
 Image 1 of 4
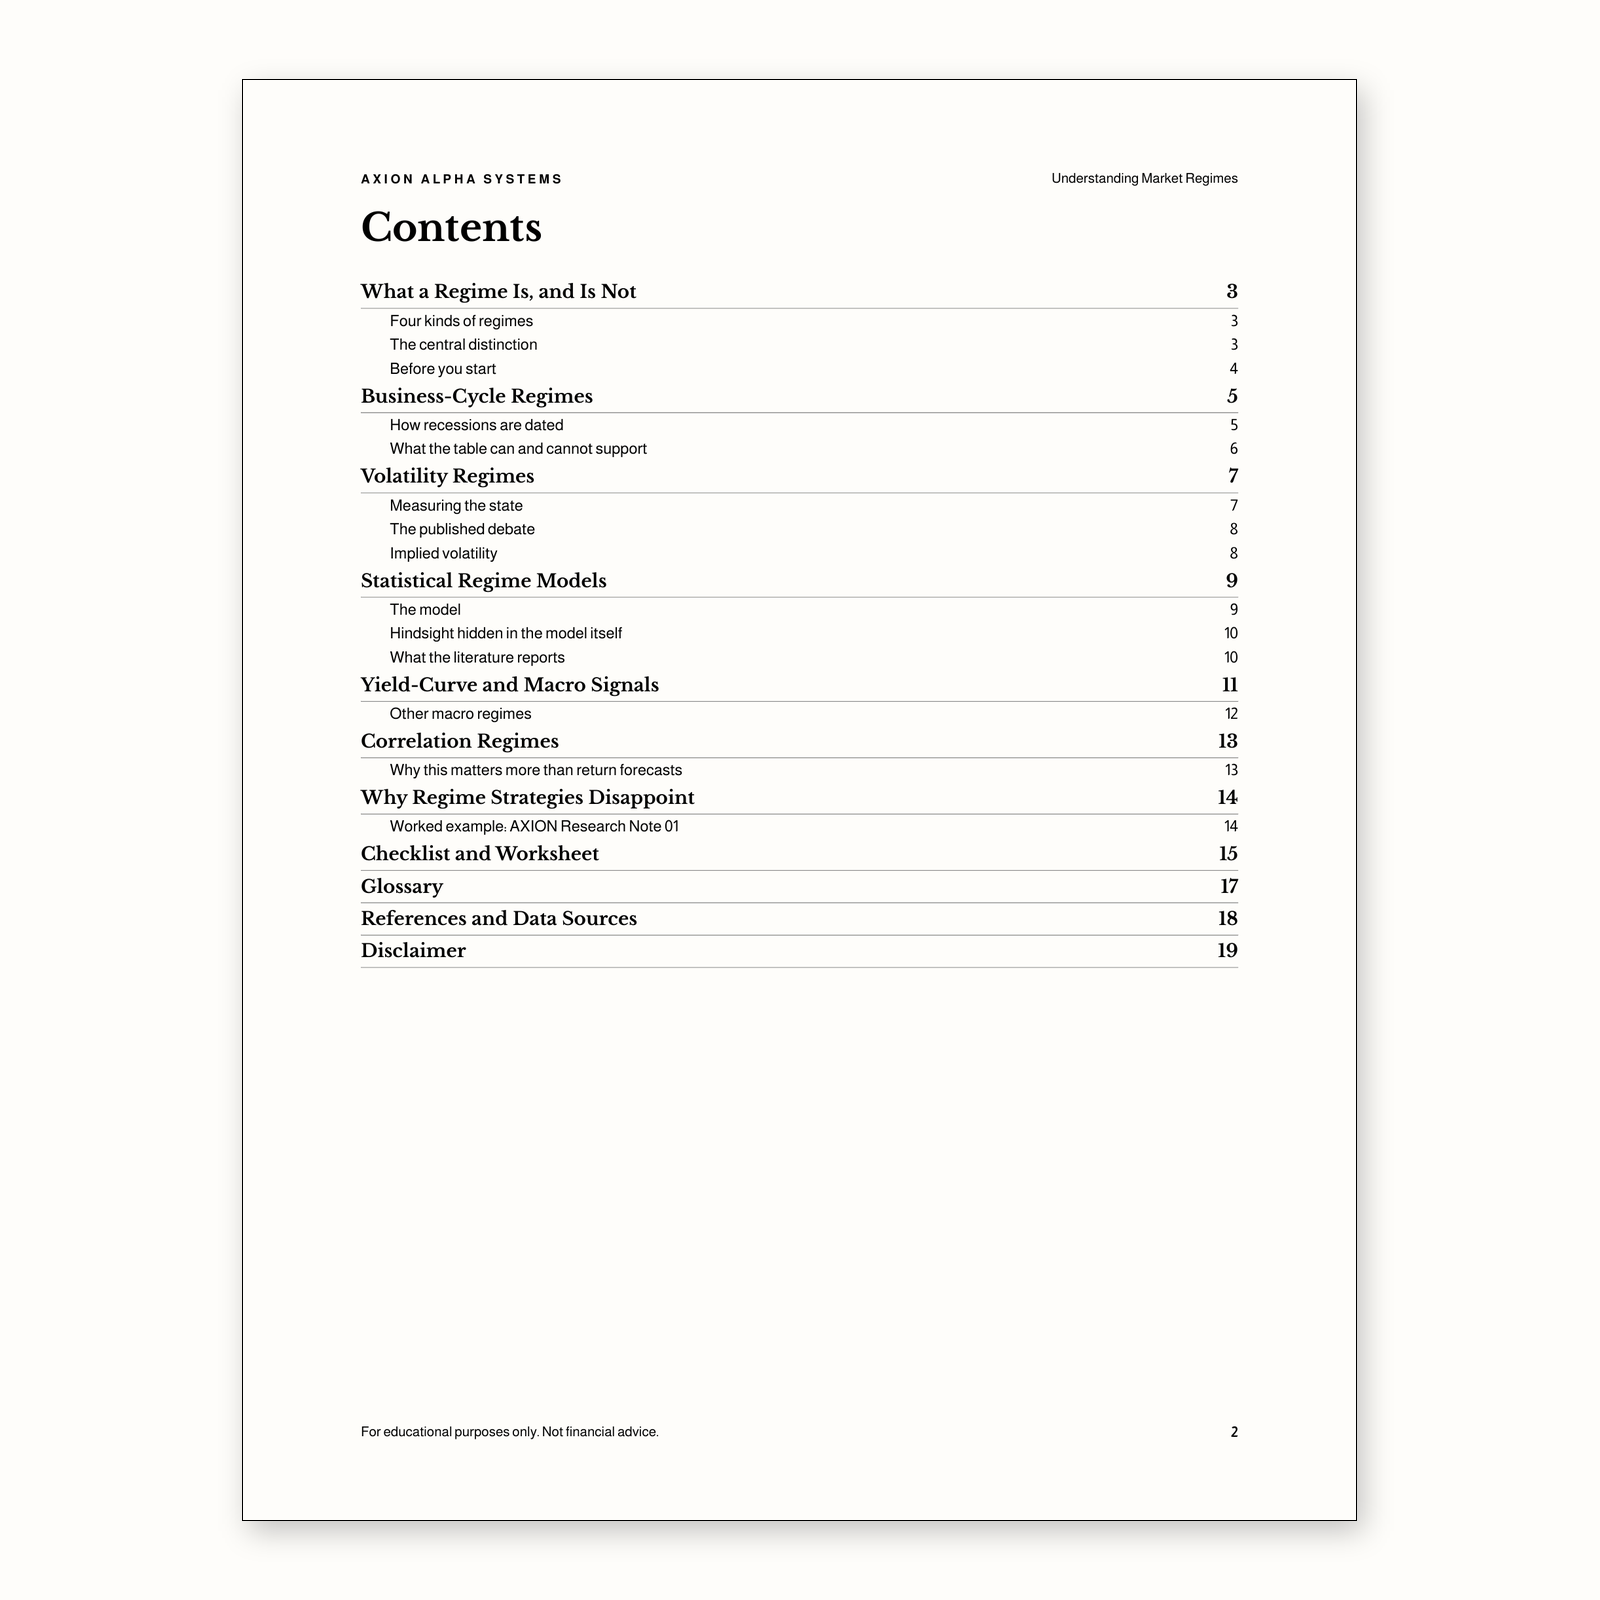 Image 2 of 4
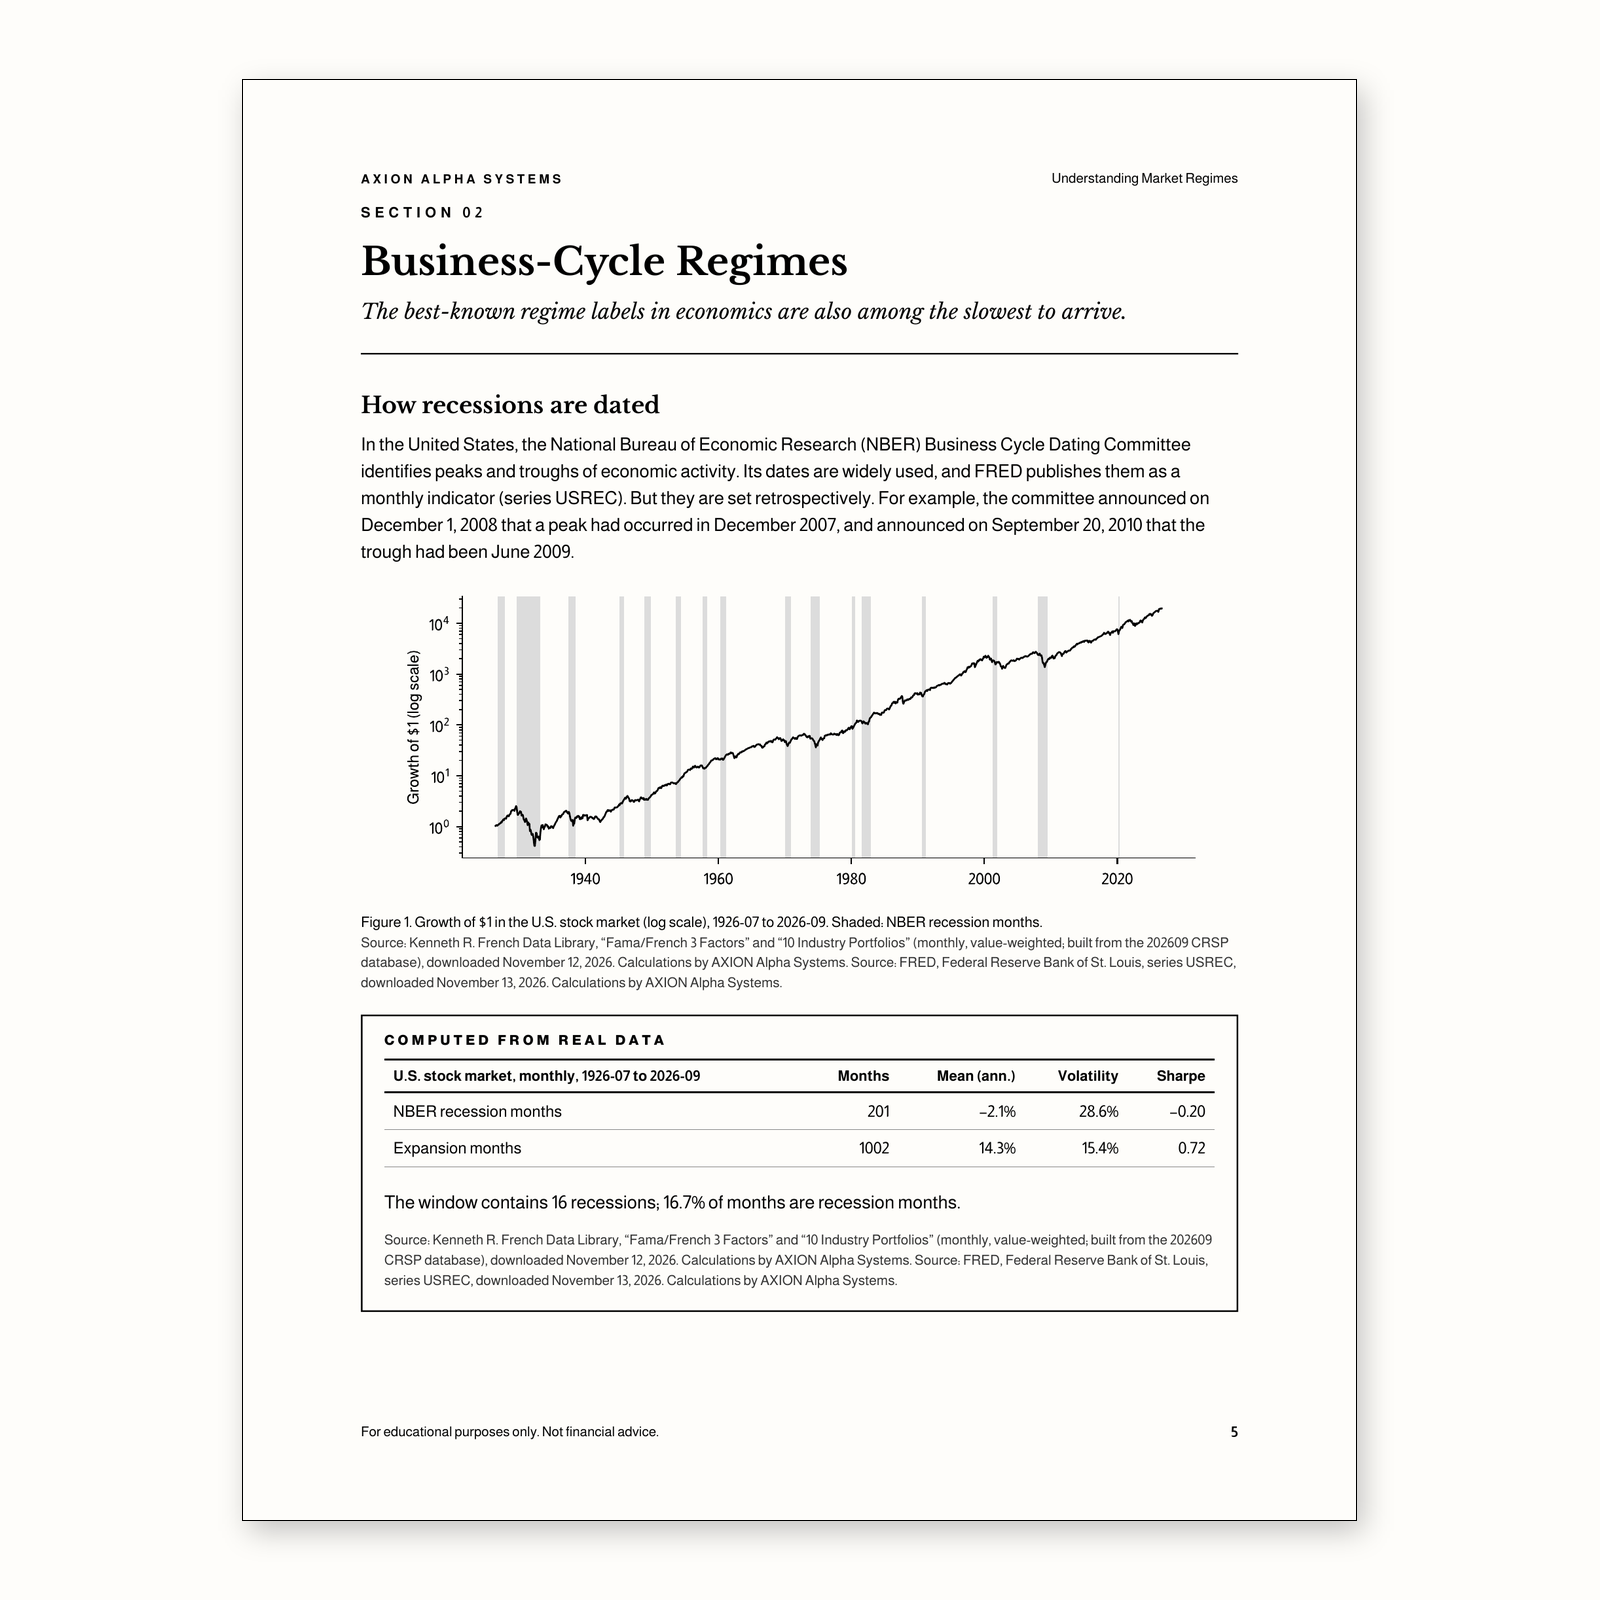 Image 3 of 4
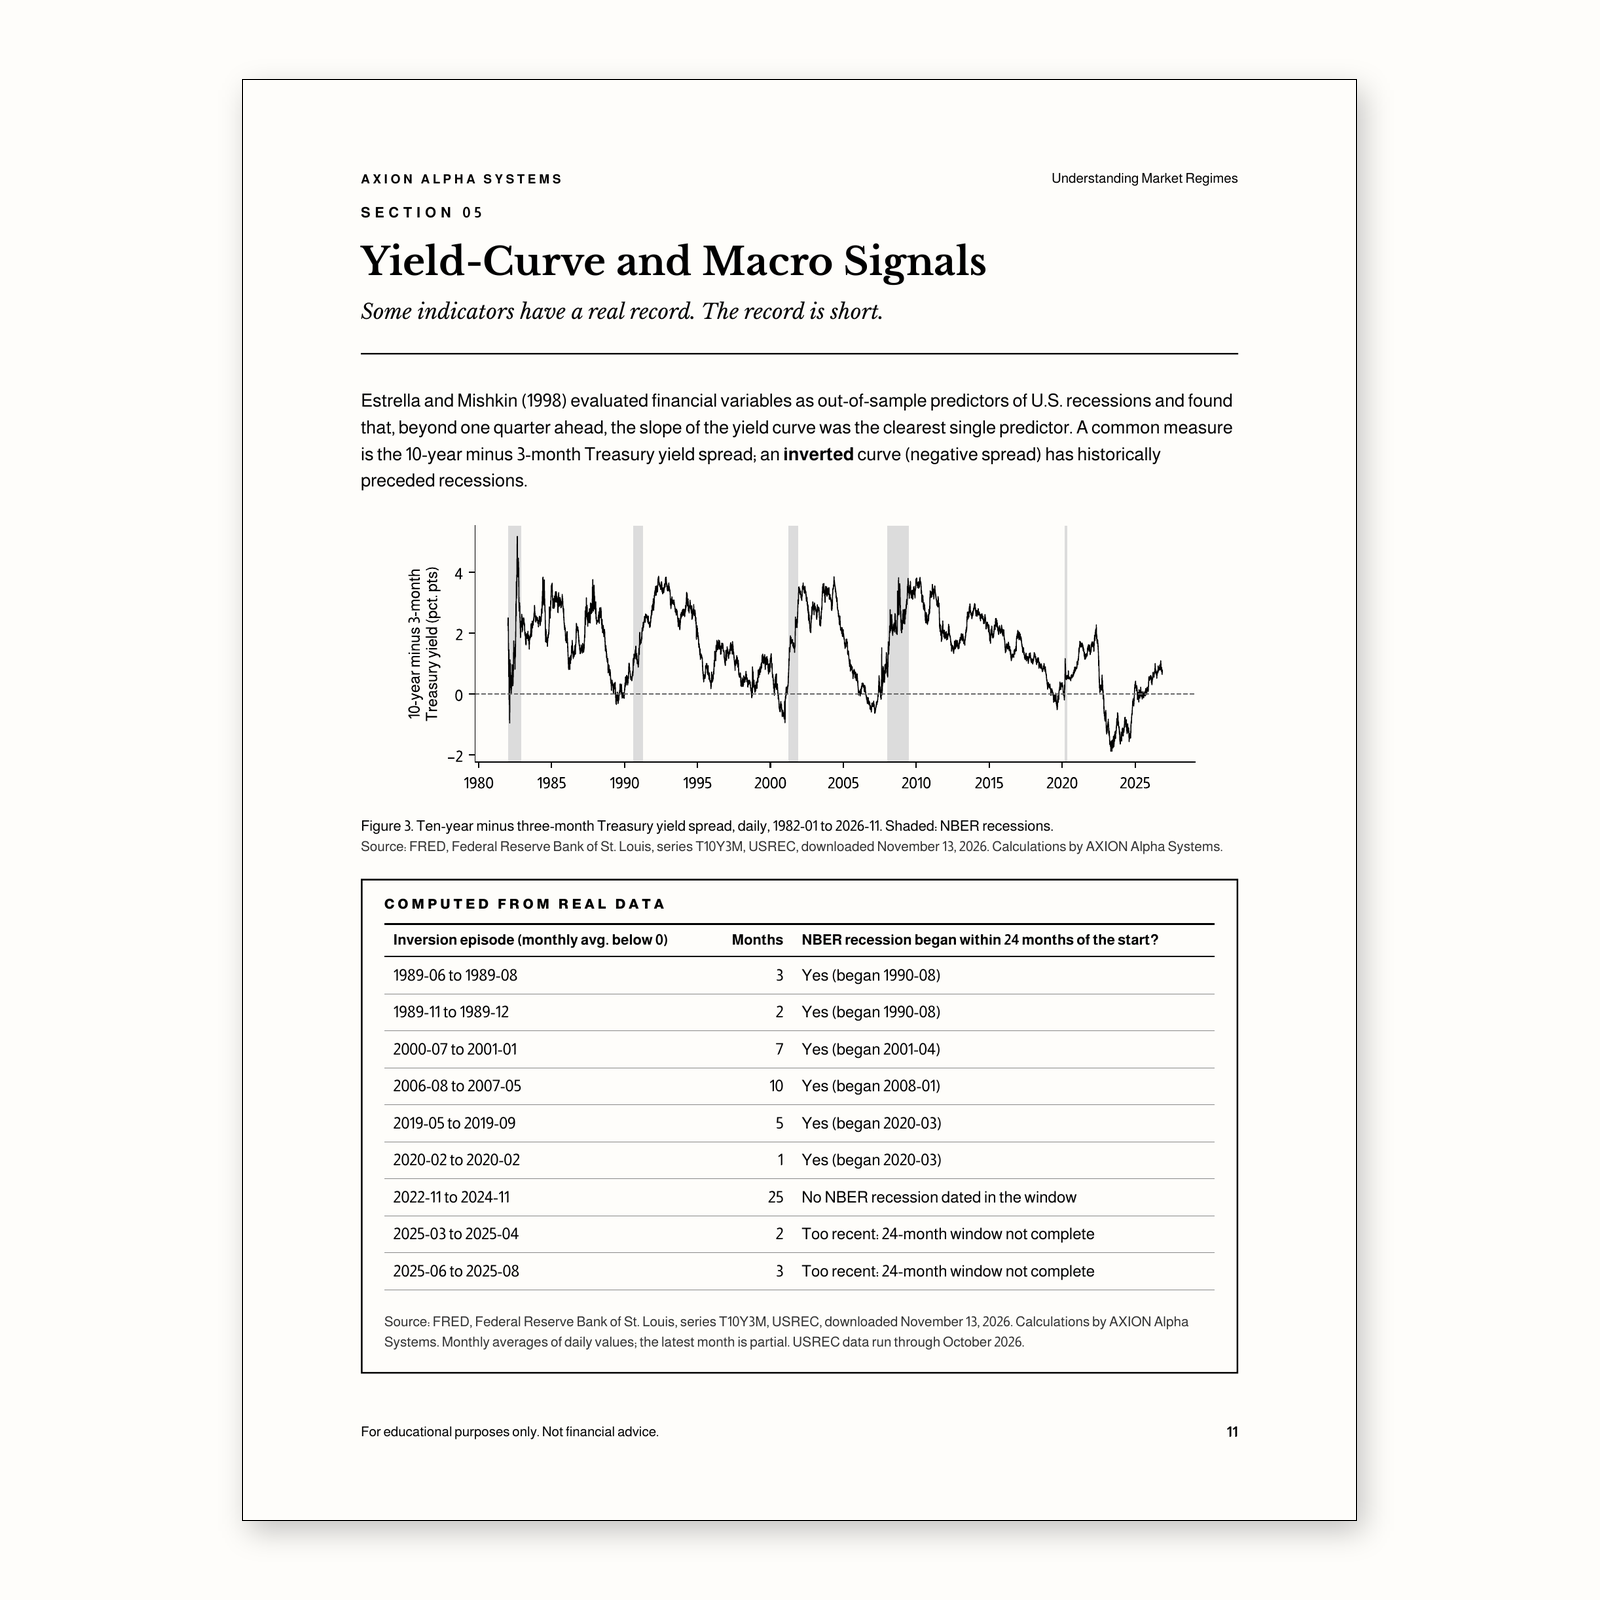 Image 4 of 4
A 19-page PDF on market regimes: how recessions, volatility states, statistical regime models, yield-curve signals, and stock–bond correlation shifts are defined and measured, and why they are far easier to see in hindsight than in real time. Includes a checklist and worksheet.
Four kinds of regimes and the one question that matters: could it have been identified at the time?
Business-cycle regimes: U.S. stock returns in NBER recessions and expansions, 1926–2026, and why the labels arrive months late
Volatility regimes: how hindsight thresholds change the answer, and the published debate on volatility-managed portfolios
Markov-switching models: a two-state model fit to a century of returns, and filtered versus smoothed probabilities around 2008 and 2020
The yield curve as a recession signal: every 10-year/3-month inversion since 1982 and what followed, including the 2022–2024 inversion
Stock–bond correlation regimes and what they mean for diversification
Why regime strategies disappoint, with AXION’s own failed pre-registered test as a worked example
A 12-point checklist, a worksheet, a glossary, and full references
Self-directed investors, students, and analysts who hear regime talk in market commentary and want to evaluate it critically. Familiarity with returns, volatility, and the Sharpe ratio helps.
PDF, 19 pages, US Letter. Instant download. Includes a printable worksheet.
It is not investment advice, a market-timing system, or a forecast. No regime model or signal in it is presented as validated. Historical figures describe the past only.
Will this help me time the market?
No. It explains how regimes are defined and why real-time identification is hard. It does not provide a timing signal.
Where does the data come from?
The Kenneth R. French Data Library (September 2026 CRSP build) and FRED series USREC, VIXCLS, T10Y3M, and GS10, downloaded November 2026, with sources stated beside each figure.
Does the yield curve predict recessions?
The guide shows the historical record and its limits: a small number of episodes, and a long inversion from 2022 to 2024 not followed by an NBER recession through the latest data.
Is this investment advice?
No. It is for educational purposes only.
For educational purposes only. Not financial advice. This guide does not recommend any security, fund, or strategy, and nothing in it is a promise of future returns. Historical figures describe the past only.
A 19-page PDF on market regimes: how recessions, volatility states, statistical regime models, yield-curve signals, and stock–bond correlation shifts are defined and measured, and why they are far easier to see in hindsight than in real time. Includes a checklist and worksheet.
Four kinds of regimes and the one question that matters: could it have been identified at the time?
Business-cycle regimes: U.S. stock returns in NBER recessions and expansions, 1926–2026, and why the labels arrive months late
Volatility regimes: how hindsight thresholds change the answer, and the published debate on volatility-managed portfolios
Markov-switching models: a two-state model fit to a century of returns, and filtered versus smoothed probabilities around 2008 and 2020
The yield curve as a recession signal: every 10-year/3-month inversion since 1982 and what followed, including the 2022–2024 inversion
Stock–bond correlation regimes and what they mean for diversification
Why regime strategies disappoint, with AXION’s own failed pre-registered test as a worked example
A 12-point checklist, a worksheet, a glossary, and full references
Self-directed investors, students, and analysts who hear regime talk in market commentary and want to evaluate it critically. Familiarity with returns, volatility, and the Sharpe ratio helps.
PDF, 19 pages, US Letter. Instant download. Includes a printable worksheet.
It is not investment advice, a market-timing system, or a forecast. No regime model or signal in it is presented as validated. Historical figures describe the past only.
Will this help me time the market?
No. It explains how regimes are defined and why real-time identification is hard. It does not provide a timing signal.
Where does the data come from?
The Kenneth R. French Data Library (September 2026 CRSP build) and FRED series USREC, VIXCLS, T10Y3M, and GS10, downloaded November 2026, with sources stated beside each figure.
Does the yield curve predict recessions?
The guide shows the historical record and its limits: a small number of episodes, and a long inversion from 2022 to 2024 not followed by an NBER recession through the latest data.
Is this investment advice?
No. It is for educational purposes only.
For educational purposes only. Not financial advice. This guide does not recommend any security, fund, or strategy, and nothing in it is a promise of future returns. Historical figures describe the past only.