
 Image 1 of 4
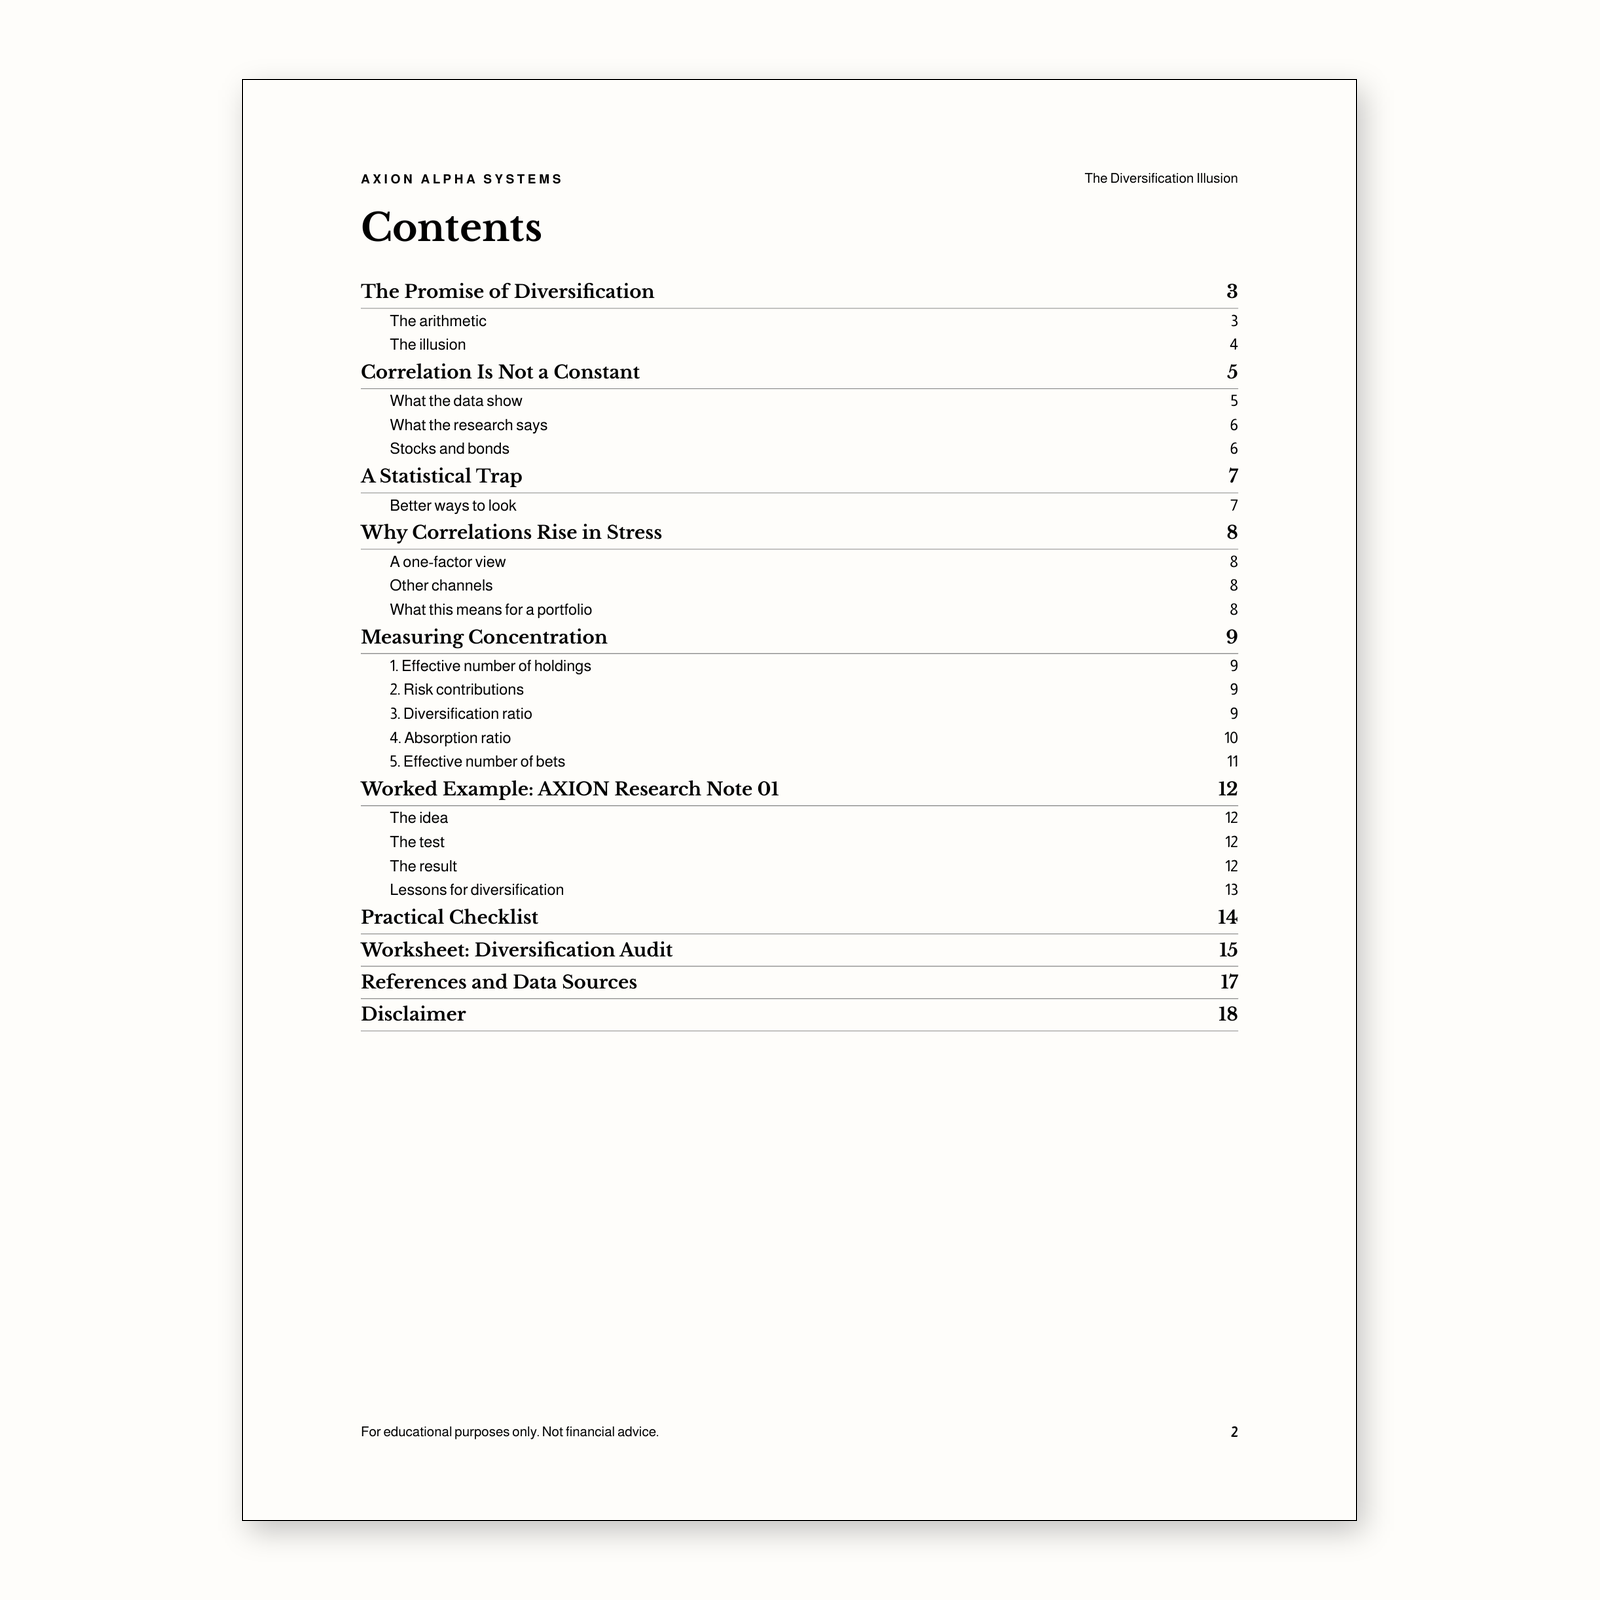 Image 2 of 4
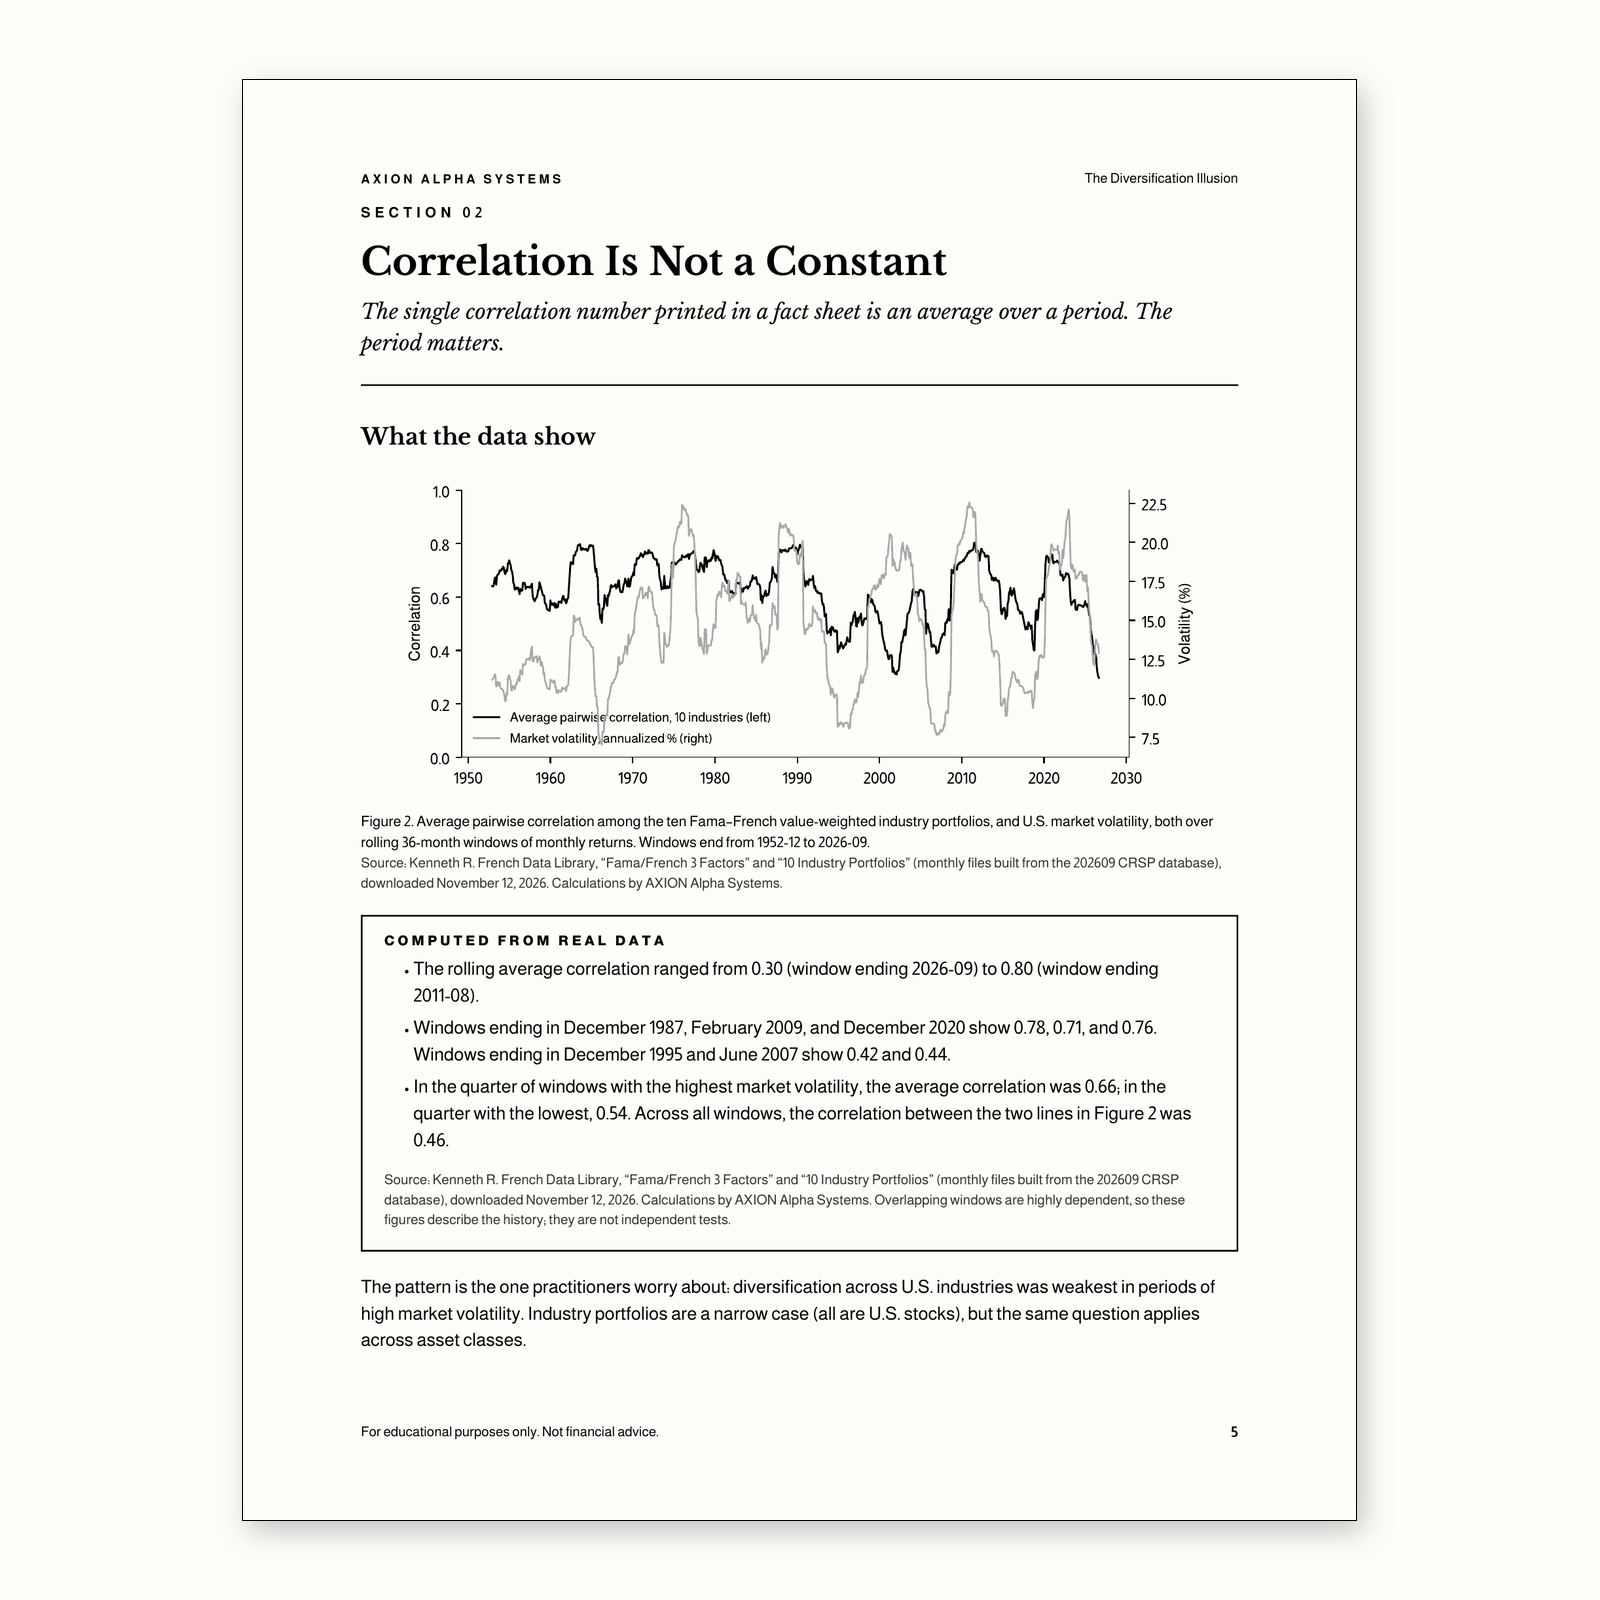 Image 3 of 4
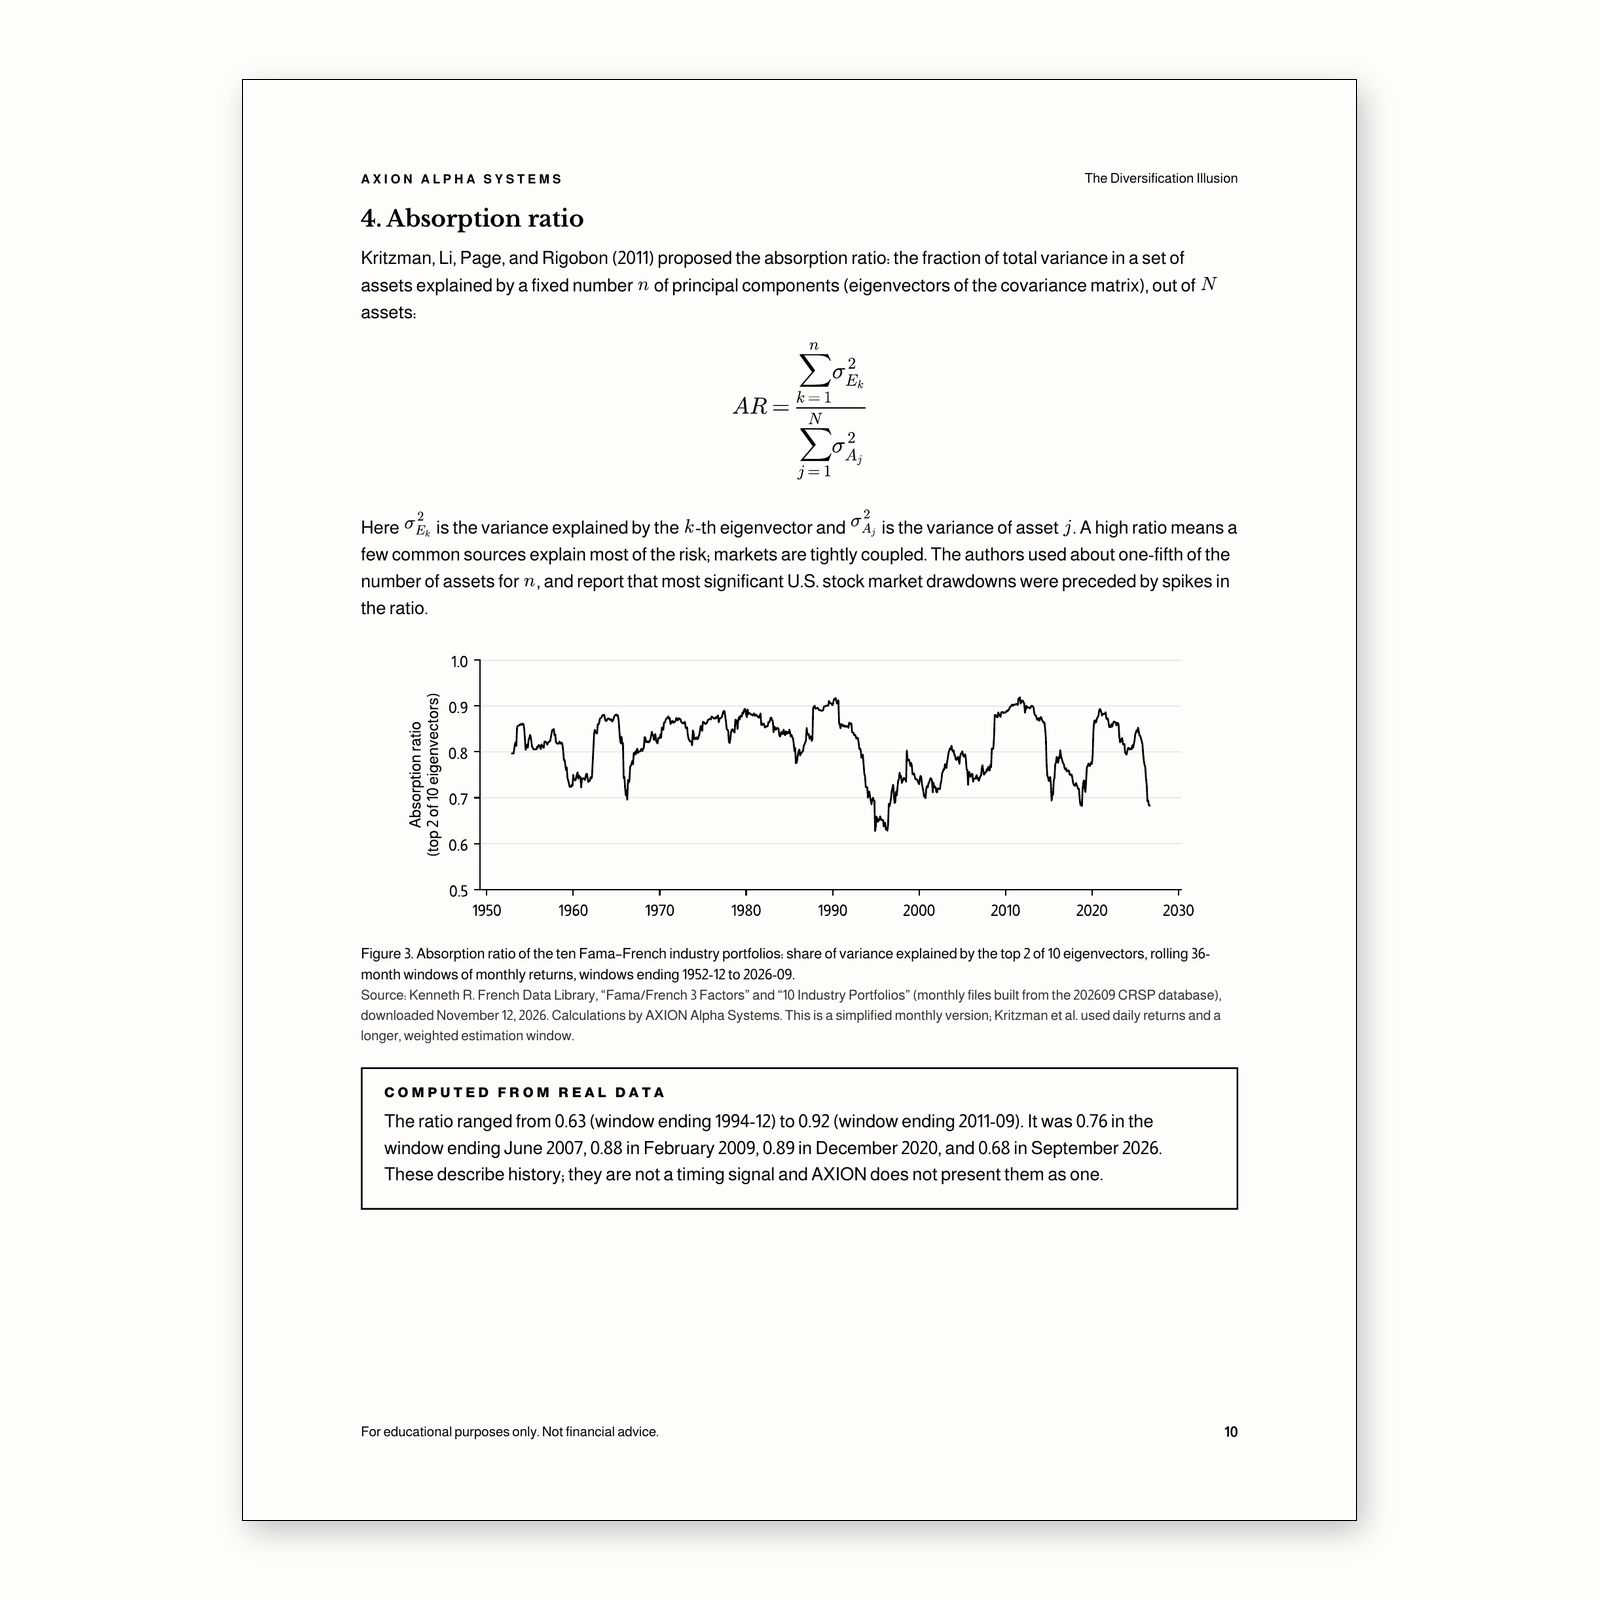 Image 4 of 4
An 18-page PDF on why portfolios that look diversified often behave like one bet under stress, how to measure that honestly, and what to check in your own portfolio. Includes a 15-point checklist and a fill-in audit worksheet.
The arithmetic of diversification, and why average correlation, not the number of holdings, sets the floor on risk
How correlations among U.S. industries have changed since the 1950s, computed from the Kenneth French Data Library
What the research says: Longin & Solnik (2001), Ang & Chen (2002), Forbes & Rigobon (2002)
A common statistical trap in “correlations go to one” claims (Boyer, Gibson & Loretan), shown with real data
Why correlations rise in stress: a one-factor model, funding liquidity, and shared macro drivers
Measuring concentration: effective number of holdings, risk contributions, diversification ratio, absorption ratio, and effective number of bets
A worked example: AXION Research Note 01, a pre-registered test of a correlation-based strategy that failed
A practical checklist and a printable diversification audit worksheet
Self-directed investors, students, and analysts who want to understand portfolio concentration and correlation risk beyond a single “diversified” label. Some comfort with percentages helps; the formulas are explained step by step.
PDF, 18 pages, US Letter. Instant download. Includes a printable worksheet.
It is not investment advice and does not recommend any allocation, fund, or strategy. It does not offer a timing signal: the correlation and absorption-ratio history shown is descriptive, and the worked example reports a strategy that failed its tests.
Does this tell me how to allocate my portfolio?
No. It explains how diversification works and how to measure it, and gives questions to ask. Decisions about your own portfolio should consider your full situation, ideally with a licensed professional.
Is the absorption ratio a market-timing tool?
The guide presents it as a descriptive measure of how tightly markets are coupled. AXION’s own pre-registered test of a strategy that used it did not find that it added value. See AXION Research Note 01.
Where does the data come from?
Real-data figures use the Kenneth R. French Data Library (10 U.S. industry portfolios and the Fama–French factors, September 2026 CRSP build), with dates stated. Teaching examples are labeled illustrative.
Is this investment advice?
No. It is for educational purposes only.
For educational purposes only. Not financial advice. This guide does not recommend any security, fund, or strategy, and nothing in it is a promise of future returns. Historical figures describe the past only.
An 18-page PDF on why portfolios that look diversified often behave like one bet under stress, how to measure that honestly, and what to check in your own portfolio. Includes a 15-point checklist and a fill-in audit worksheet.
The arithmetic of diversification, and why average correlation, not the number of holdings, sets the floor on risk
How correlations among U.S. industries have changed since the 1950s, computed from the Kenneth French Data Library
What the research says: Longin & Solnik (2001), Ang & Chen (2002), Forbes & Rigobon (2002)
A common statistical trap in “correlations go to one” claims (Boyer, Gibson & Loretan), shown with real data
Why correlations rise in stress: a one-factor model, funding liquidity, and shared macro drivers
Measuring concentration: effective number of holdings, risk contributions, diversification ratio, absorption ratio, and effective number of bets
A worked example: AXION Research Note 01, a pre-registered test of a correlation-based strategy that failed
A practical checklist and a printable diversification audit worksheet
Self-directed investors, students, and analysts who want to understand portfolio concentration and correlation risk beyond a single “diversified” label. Some comfort with percentages helps; the formulas are explained step by step.
PDF, 18 pages, US Letter. Instant download. Includes a printable worksheet.
It is not investment advice and does not recommend any allocation, fund, or strategy. It does not offer a timing signal: the correlation and absorption-ratio history shown is descriptive, and the worked example reports a strategy that failed its tests.
Does this tell me how to allocate my portfolio?
No. It explains how diversification works and how to measure it, and gives questions to ask. Decisions about your own portfolio should consider your full situation, ideally with a licensed professional.
Is the absorption ratio a market-timing tool?
The guide presents it as a descriptive measure of how tightly markets are coupled. AXION’s own pre-registered test of a strategy that used it did not find that it added value. See AXION Research Note 01.
Where does the data come from?
Real-data figures use the Kenneth R. French Data Library (10 U.S. industry portfolios and the Fama–French factors, September 2026 CRSP build), with dates stated. Teaching examples are labeled illustrative.
Is this investment advice?
No. It is for educational purposes only.
For educational purposes only. Not financial advice. This guide does not recommend any security, fund, or strategy, and nothing in it is a promise of future returns. Historical figures describe the past only.