
 Image 1 of 4
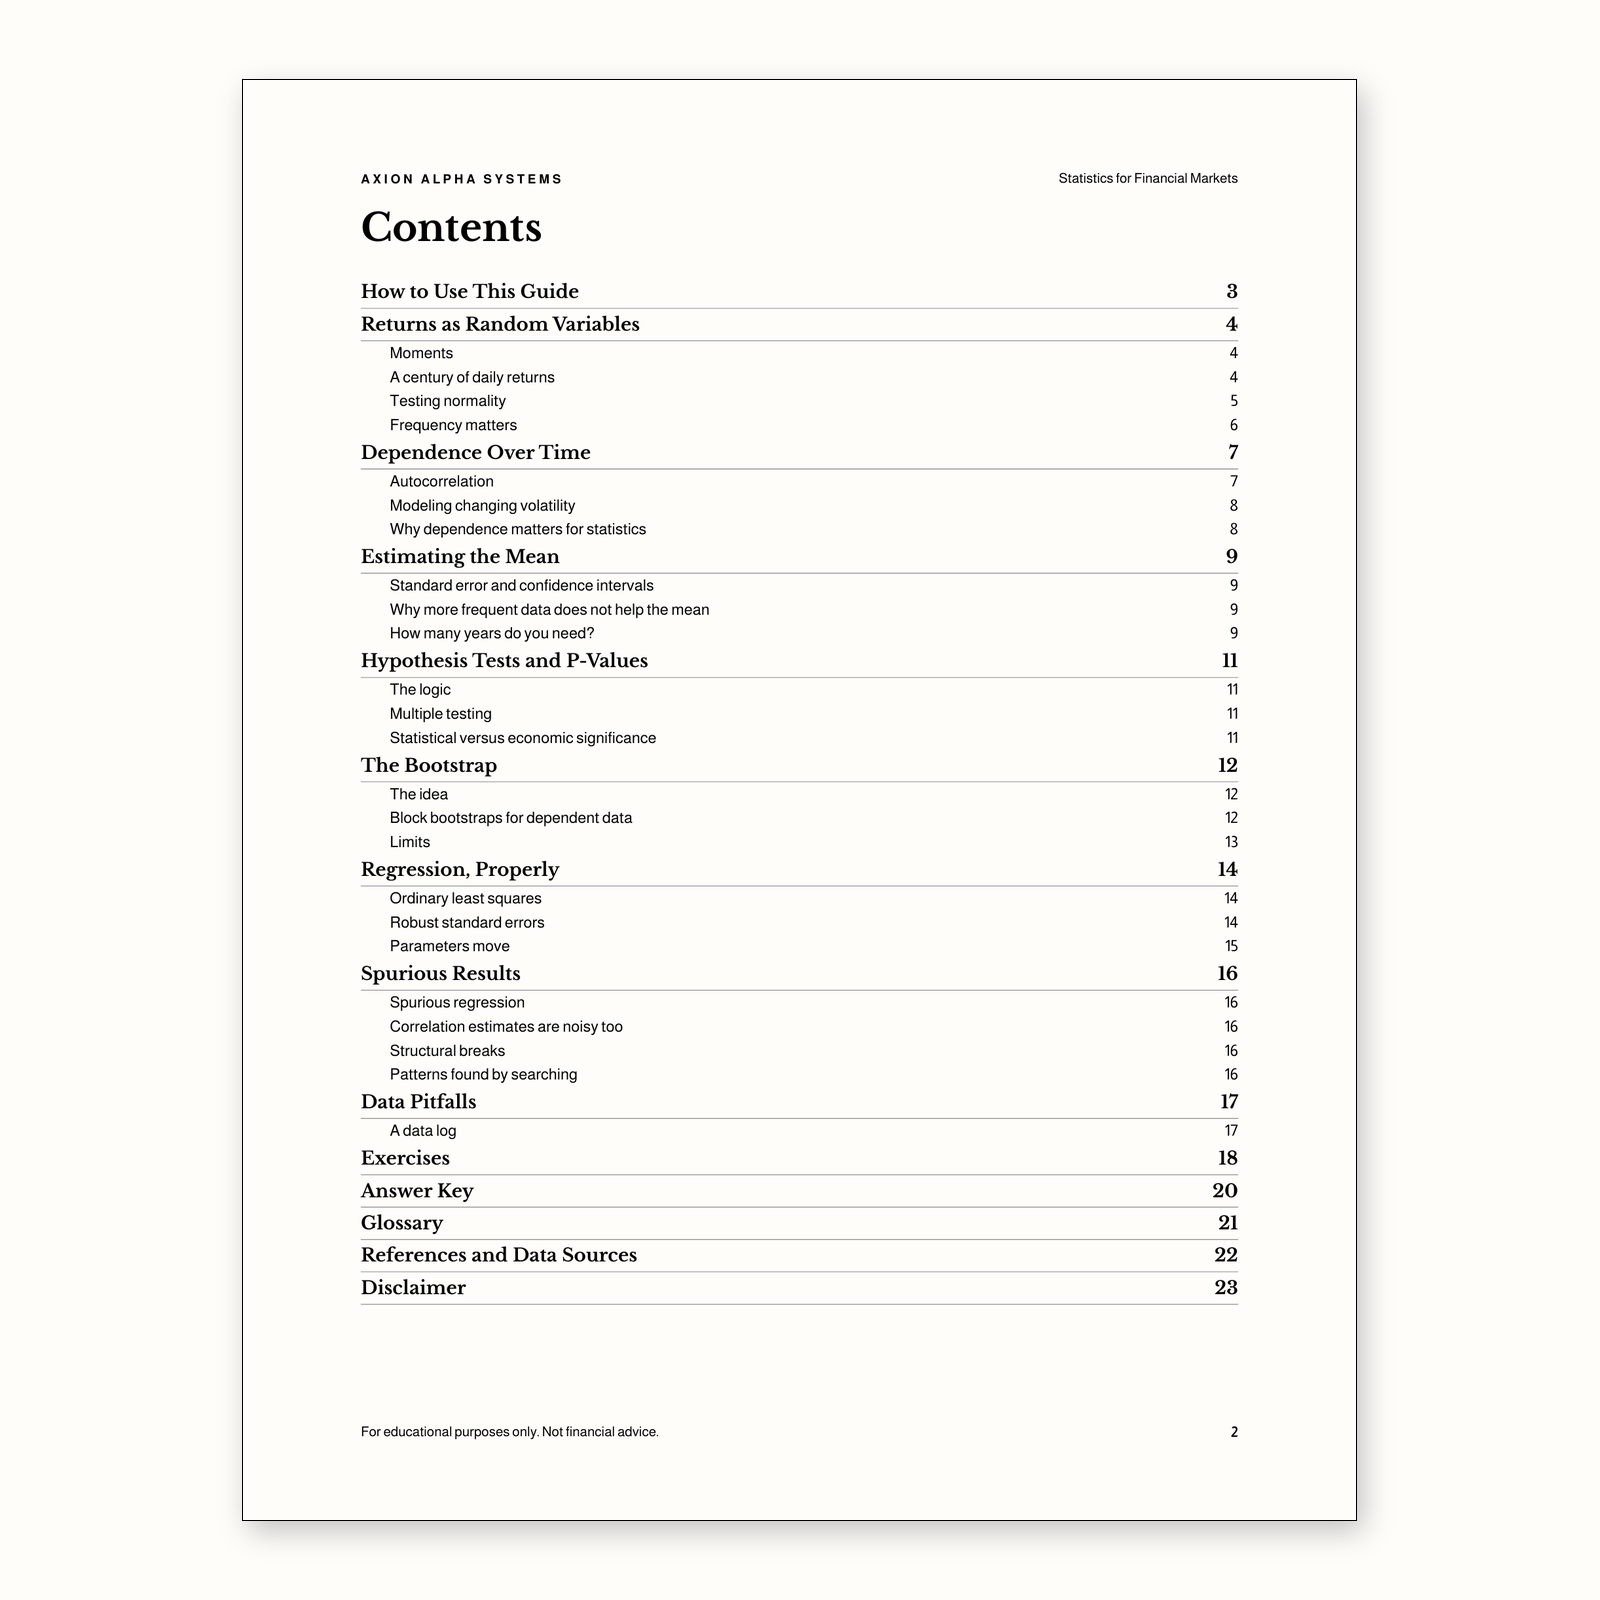 Image 2 of 4
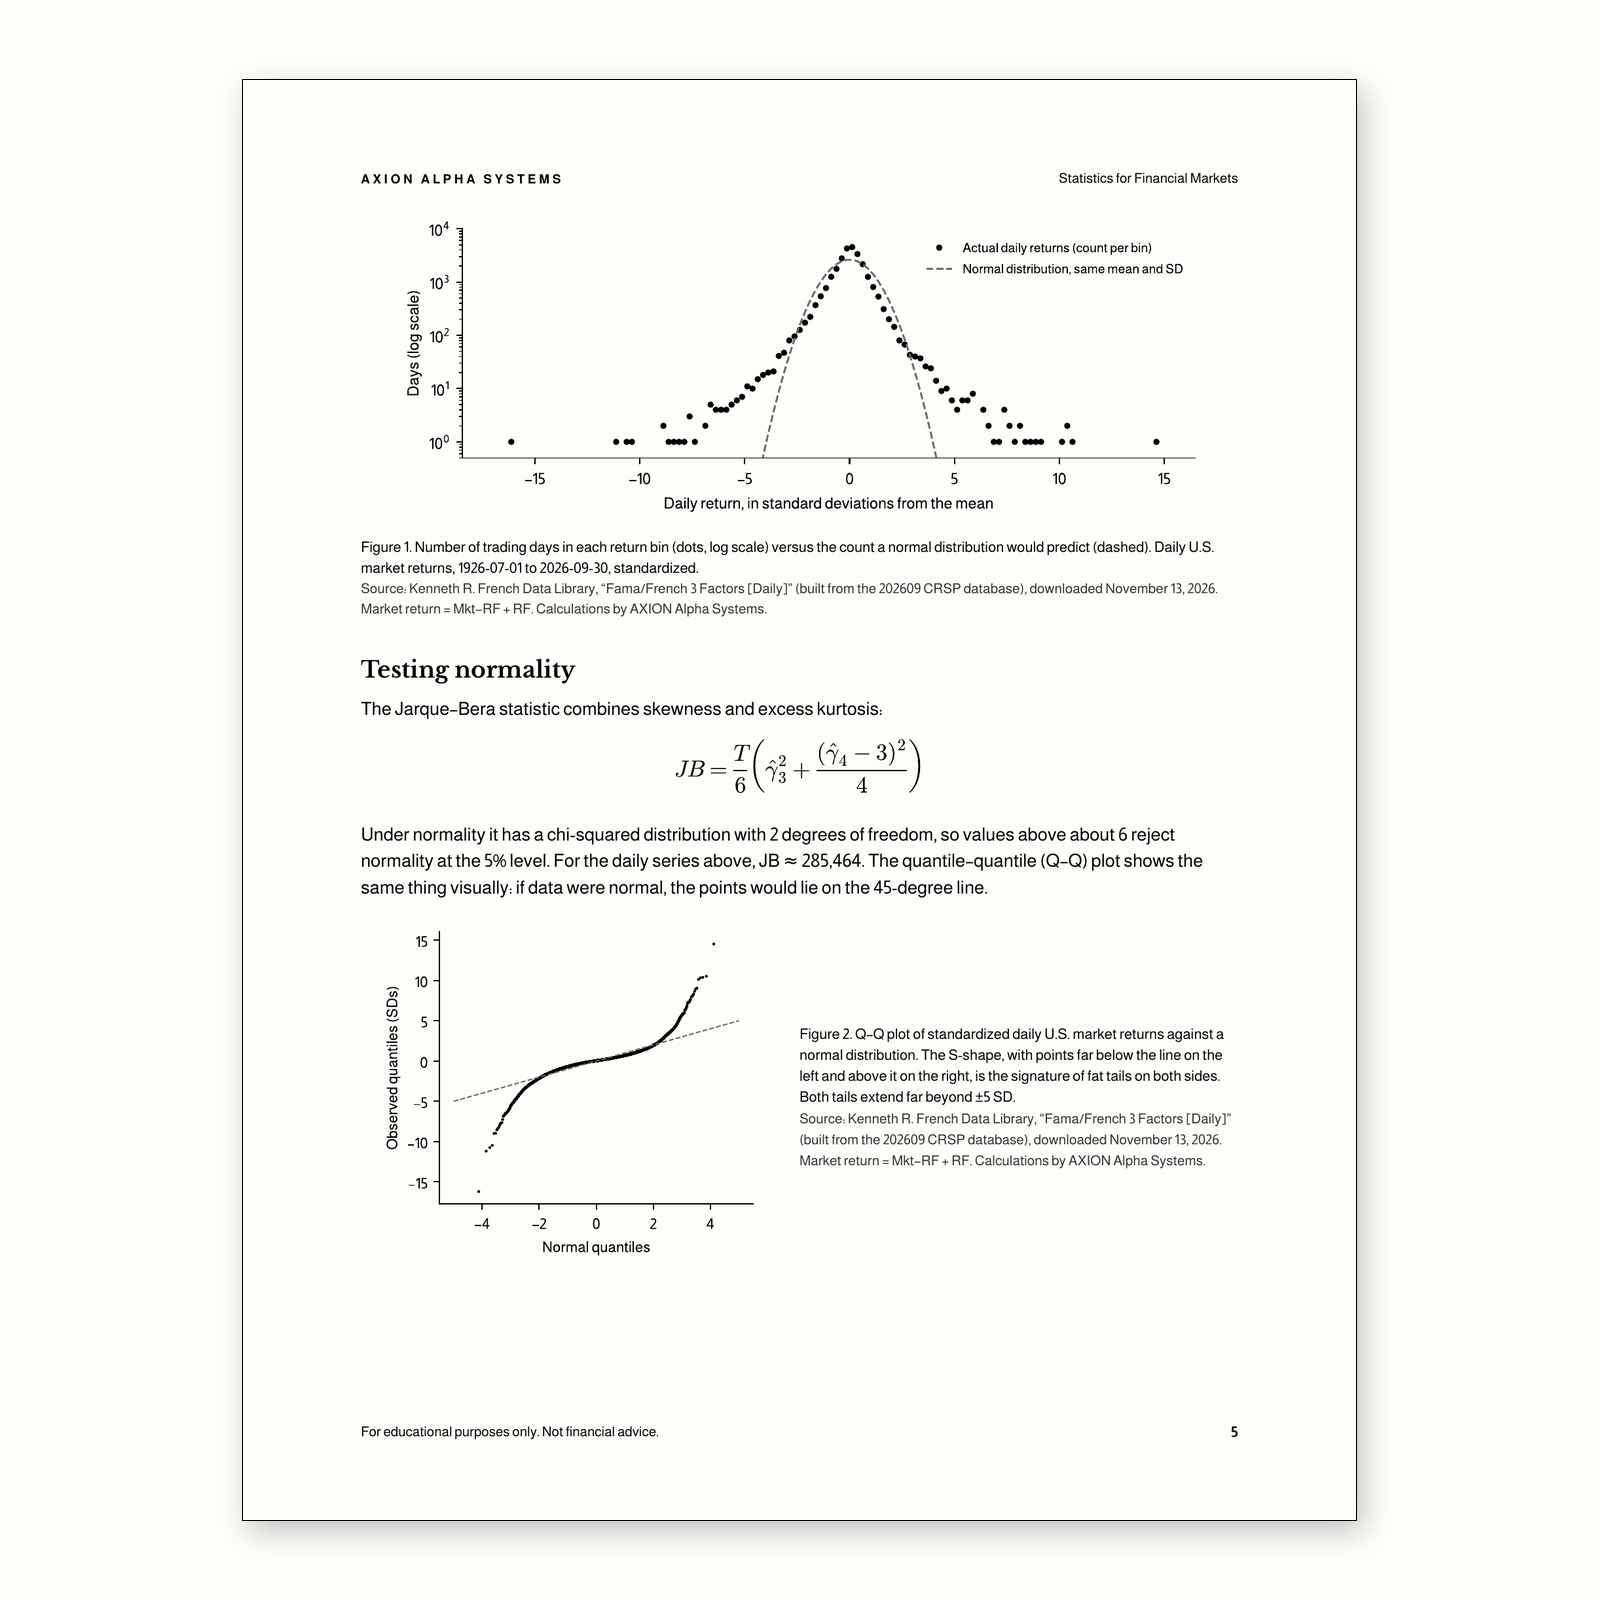 Image 3 of 4
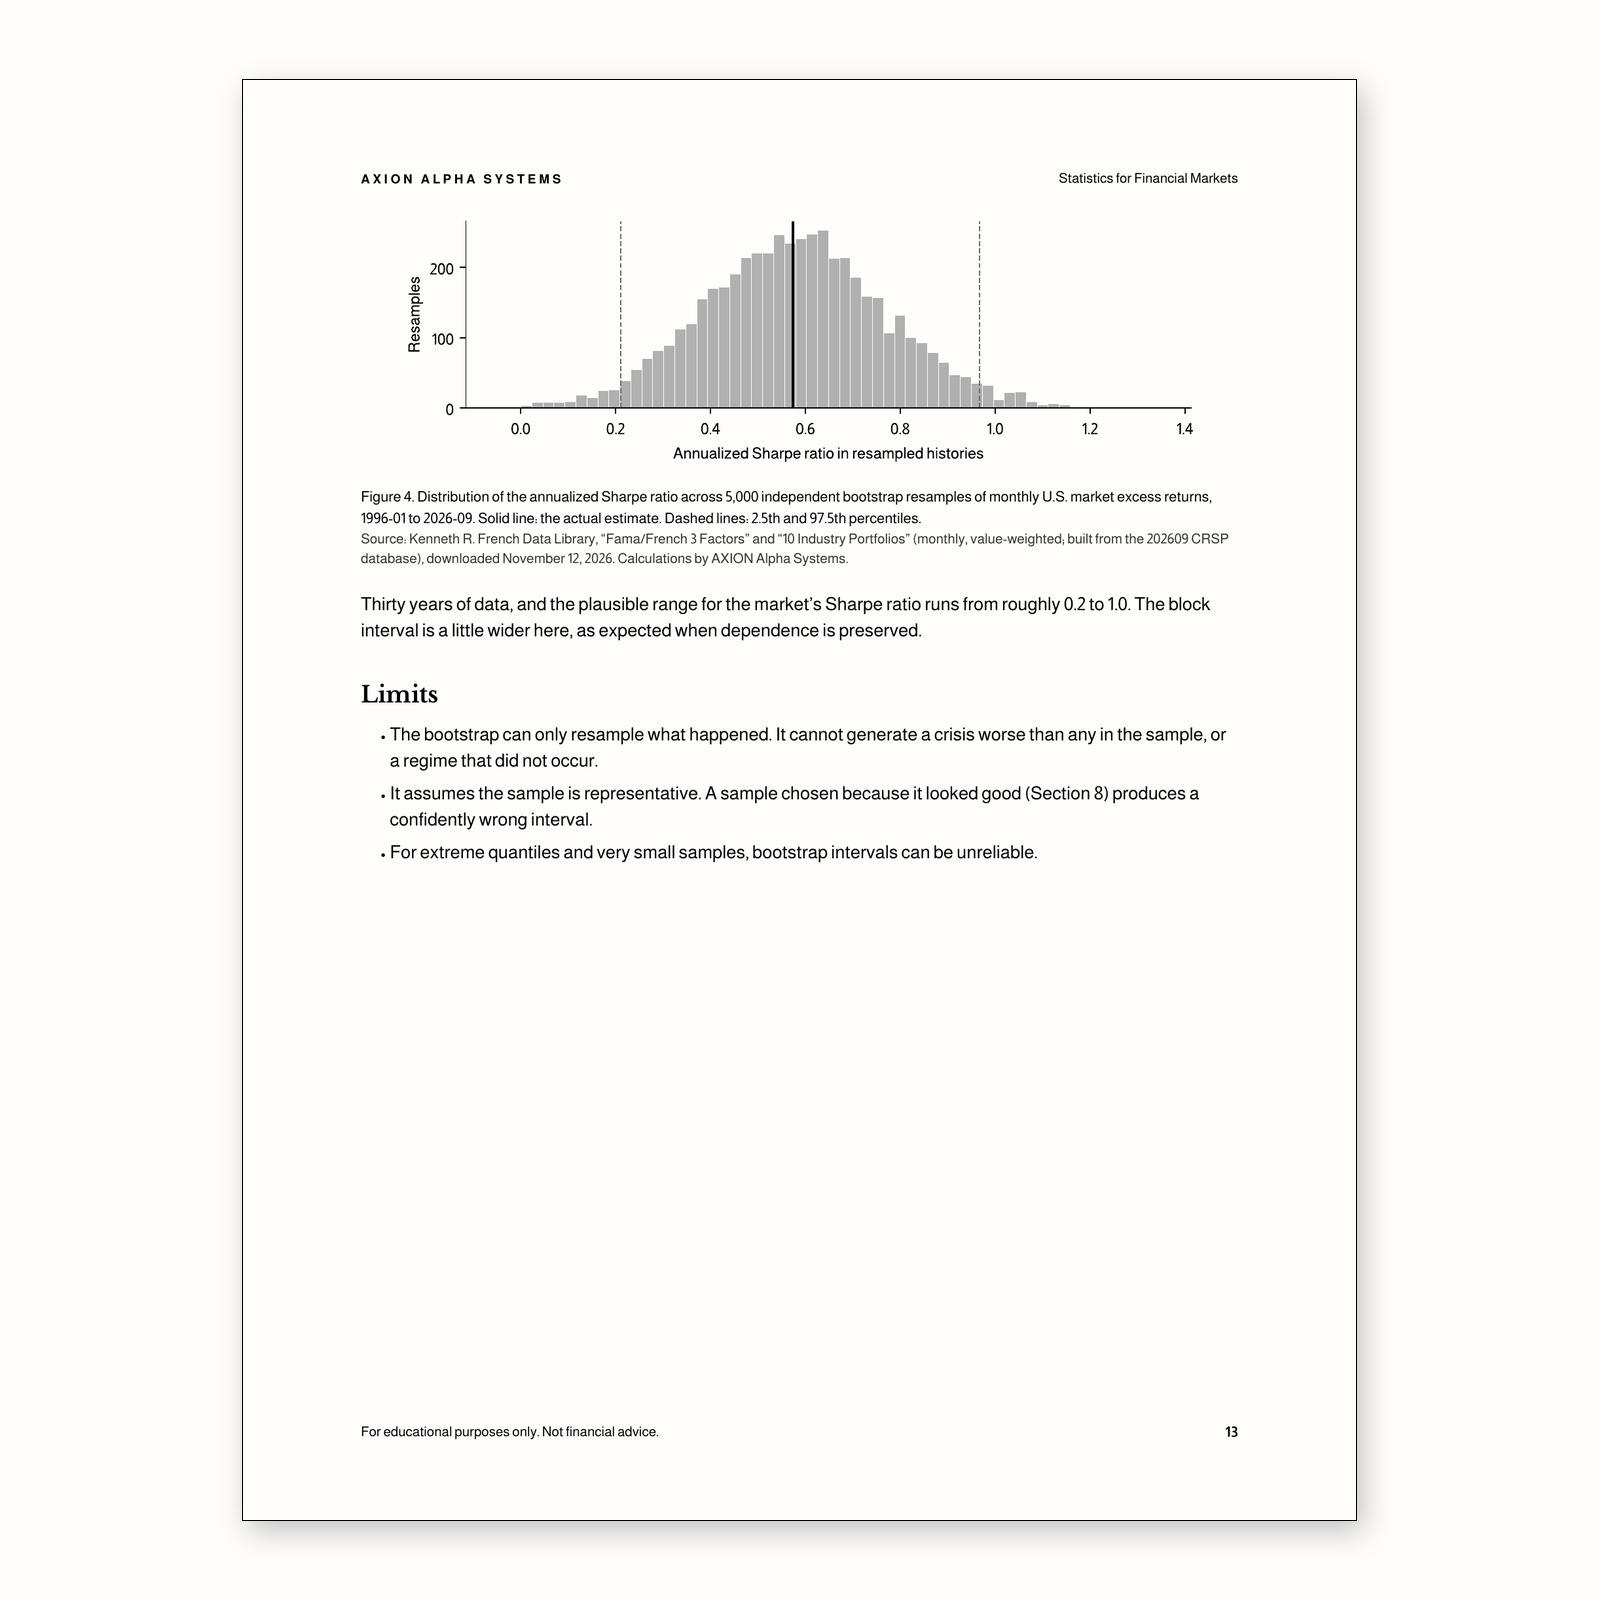 Image 4 of 4
A 23-page PDF on the statistics investment research depends on, and the ways it goes wrong with market data: fat tails, volatility clustering, noisy means, multiple testing, overlapping data, and spurious regressions. Includes 10 exercises with a worked answer key.
Returns as random variables: moments, skewness, kurtosis, and how fat the tails of daily U.S. stock returns really are (real data, 1926–2026)
Dependence over time: autocorrelation, volatility clustering, and an introduction to ARCH and GARCH
Why mean returns are so hard to estimate, with confidence intervals for a century of market returns
Hypothesis tests, p-values, power, and multiple-testing corrections (Bonferroni, Benjamini–Hochberg, higher t-hurdles)
The bootstrap, including block bootstrap for dependent data
Regression done properly: robust and Newey–West standard errors, and a rolling-beta example
Spurious results: nonstationary regressions, overlapping returns, data mining, and structural breaks
Data pitfalls: survivorship, look-ahead, frequency, and outliers
10 exercises with a worked answer key, a glossary, and full references
Students, self-directed learners, and analysts who know the basics of returns and volatility and want to judge statistical claims about markets with confidence. Comfort with algebra helps; AXION’s Quantitative Finance Foundations covers the prerequisites.
PDF, 23 pages, US Letter. Instant download. Formulas typeset; charts in black and gray.
It is not investment advice and does not recommend any security, fund, or strategy. Historical figures describe the past and are not forecasts. Exercise numbers are illustrative.
What math do I need?
Algebra and comfort with averages and standard deviations. Formulas are explained in words and worked through; no calculus is required.
Where do the numbers come from?
Real-data figures are computed from the Kenneth R. French Data Library (September 2026 CRSP build, monthly and daily files), with sources and download dates stated beside each one. Example data are labeled as such.
Does it include code?
No. The methods are explained so you can apply them in any tool, including a spreadsheet or a statistics package.
Is this investment advice?
No. It is for educational purposes only.
For educational purposes only. Not financial advice. This guide does not recommend any security, fund, or strategy, and nothing in it is a promise of future returns. Historical figures describe the past only.
A 23-page PDF on the statistics investment research depends on, and the ways it goes wrong with market data: fat tails, volatility clustering, noisy means, multiple testing, overlapping data, and spurious regressions. Includes 10 exercises with a worked answer key.
Returns as random variables: moments, skewness, kurtosis, and how fat the tails of daily U.S. stock returns really are (real data, 1926–2026)
Dependence over time: autocorrelation, volatility clustering, and an introduction to ARCH and GARCH
Why mean returns are so hard to estimate, with confidence intervals for a century of market returns
Hypothesis tests, p-values, power, and multiple-testing corrections (Bonferroni, Benjamini–Hochberg, higher t-hurdles)
The bootstrap, including block bootstrap for dependent data
Regression done properly: robust and Newey–West standard errors, and a rolling-beta example
Spurious results: nonstationary regressions, overlapping returns, data mining, and structural breaks
Data pitfalls: survivorship, look-ahead, frequency, and outliers
10 exercises with a worked answer key, a glossary, and full references
Students, self-directed learners, and analysts who know the basics of returns and volatility and want to judge statistical claims about markets with confidence. Comfort with algebra helps; AXION’s Quantitative Finance Foundations covers the prerequisites.
PDF, 23 pages, US Letter. Instant download. Formulas typeset; charts in black and gray.
It is not investment advice and does not recommend any security, fund, or strategy. Historical figures describe the past and are not forecasts. Exercise numbers are illustrative.
What math do I need?
Algebra and comfort with averages and standard deviations. Formulas are explained in words and worked through; no calculus is required.
Where do the numbers come from?
Real-data figures are computed from the Kenneth R. French Data Library (September 2026 CRSP build, monthly and daily files), with sources and download dates stated beside each one. Example data are labeled as such.
Does it include code?
No. The methods are explained so you can apply them in any tool, including a spreadsheet or a statistics package.
Is this investment advice?
No. It is for educational purposes only.
For educational purposes only. Not financial advice. This guide does not recommend any security, fund, or strategy, and nothing in it is a promise of future returns. Historical figures describe the past only.