
 Image 1 of 4
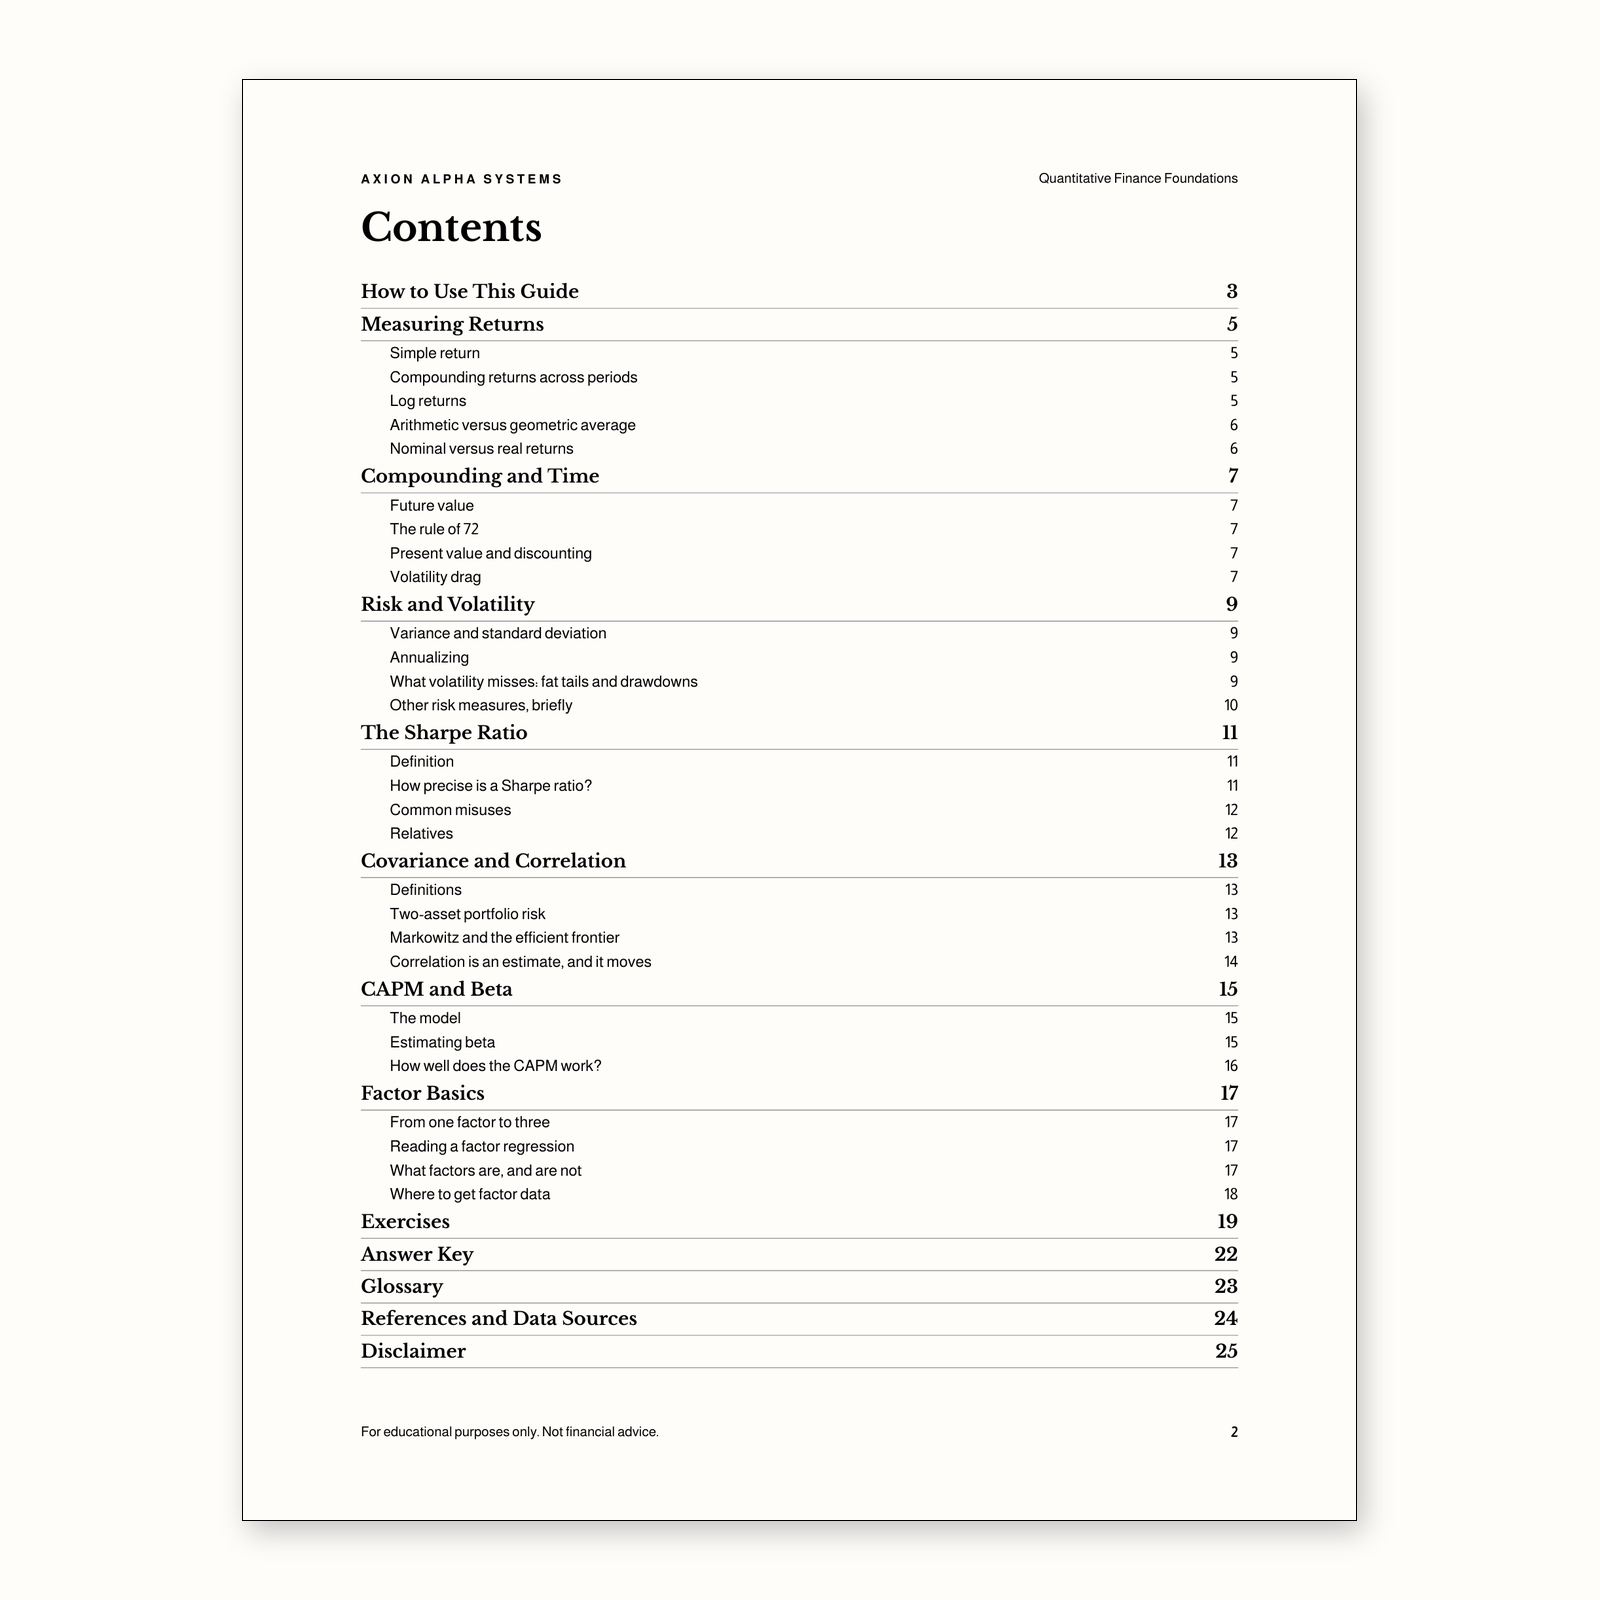 Image 2 of 4
 Image 3 of 4
 Image 4 of 4
A 25-page PDF guide to the core quantities of investment research: returns, compounding, risk, the Sharpe ratio, correlation, CAPM and beta, and factor basics. Includes 14 exercises with a worked answer key.
How to measure returns correctly: simple vs. log, arithmetic vs. geometric (CAGR), nominal vs. real
Compounding, present value, the rule of 72, and volatility drag
Volatility, annualizing, fat tails, drawdowns, VaR and expected shortfall
The Sharpe ratio, how precise it is (Lo, 2002), and how it gets misused
Covariance, correlation, two-asset portfolio risk, and the Markowitz efficient frontier
CAPM and beta, with betas for the 10 Fama–French U.S. industry portfolios (1996–2026)
Factor basics: Fama–French three-factor model, momentum, and how to read a factor regression
14 exercises with a full answer key, a 25-term glossary, and a reference list of published sources
Finance and economics students, self-directed learners, and early-career analysts who want precise definitions and formulas they can actually use, with every real-data figure sourced and reproducible from free public data (Kenneth French Data Library and FRED).
PDF, 25 pages, US Letter. Instant download. Formulas typeset; charts in black and gray.
It is not investment advice and does not recommend any security, fund, allocation, or strategy. Historical figures describe the past and are not forecasts. Exercise numbers are illustrative.
What math do I need?
Comfort with algebra, percentages, and square roots. Each formula is explained in words and worked through with a numerical example. No calculus is required.
Where do the numbers come from?
Real-data figures are computed from the Kenneth R. French Data Library (built from the September 2026 CRSP database) and FRED, with sources and dates stated beside each one. Teaching examples are clearly labeled as illustrative.
Is this investment advice?
No. It is an educational guide. It does not tell you what to buy, sell, or hold, and it makes no prediction about returns.
Can I get a refund?
This is a digital download. Please see the Refund Policy on our site for how digital goods are handled.
For educational purposes only. Not financial advice. This guide does not recommend any security, fund, or strategy, and nothing in it is a promise of future returns. Historical figures describe the past only.
A 25-page PDF guide to the core quantities of investment research: returns, compounding, risk, the Sharpe ratio, correlation, CAPM and beta, and factor basics. Includes 14 exercises with a worked answer key.
How to measure returns correctly: simple vs. log, arithmetic vs. geometric (CAGR), nominal vs. real
Compounding, present value, the rule of 72, and volatility drag
Volatility, annualizing, fat tails, drawdowns, VaR and expected shortfall
The Sharpe ratio, how precise it is (Lo, 2002), and how it gets misused
Covariance, correlation, two-asset portfolio risk, and the Markowitz efficient frontier
CAPM and beta, with betas for the 10 Fama–French U.S. industry portfolios (1996–2026)
Factor basics: Fama–French three-factor model, momentum, and how to read a factor regression
14 exercises with a full answer key, a 25-term glossary, and a reference list of published sources
Finance and economics students, self-directed learners, and early-career analysts who want precise definitions and formulas they can actually use, with every real-data figure sourced and reproducible from free public data (Kenneth French Data Library and FRED).
PDF, 25 pages, US Letter. Instant download. Formulas typeset; charts in black and gray.
It is not investment advice and does not recommend any security, fund, allocation, or strategy. Historical figures describe the past and are not forecasts. Exercise numbers are illustrative.
What math do I need?
Comfort with algebra, percentages, and square roots. Each formula is explained in words and worked through with a numerical example. No calculus is required.
Where do the numbers come from?
Real-data figures are computed from the Kenneth R. French Data Library (built from the September 2026 CRSP database) and FRED, with sources and dates stated beside each one. Teaching examples are clearly labeled as illustrative.
Is this investment advice?
No. It is an educational guide. It does not tell you what to buy, sell, or hold, and it makes no prediction about returns.
Can I get a refund?
This is a digital download. Please see the Refund Policy on our site for how digital goods are handled.
For educational purposes only. Not financial advice. This guide does not recommend any security, fund, or strategy, and nothing in it is a promise of future returns. Historical figures describe the past only.