
 Image 1 of 4
Image 2 of 4
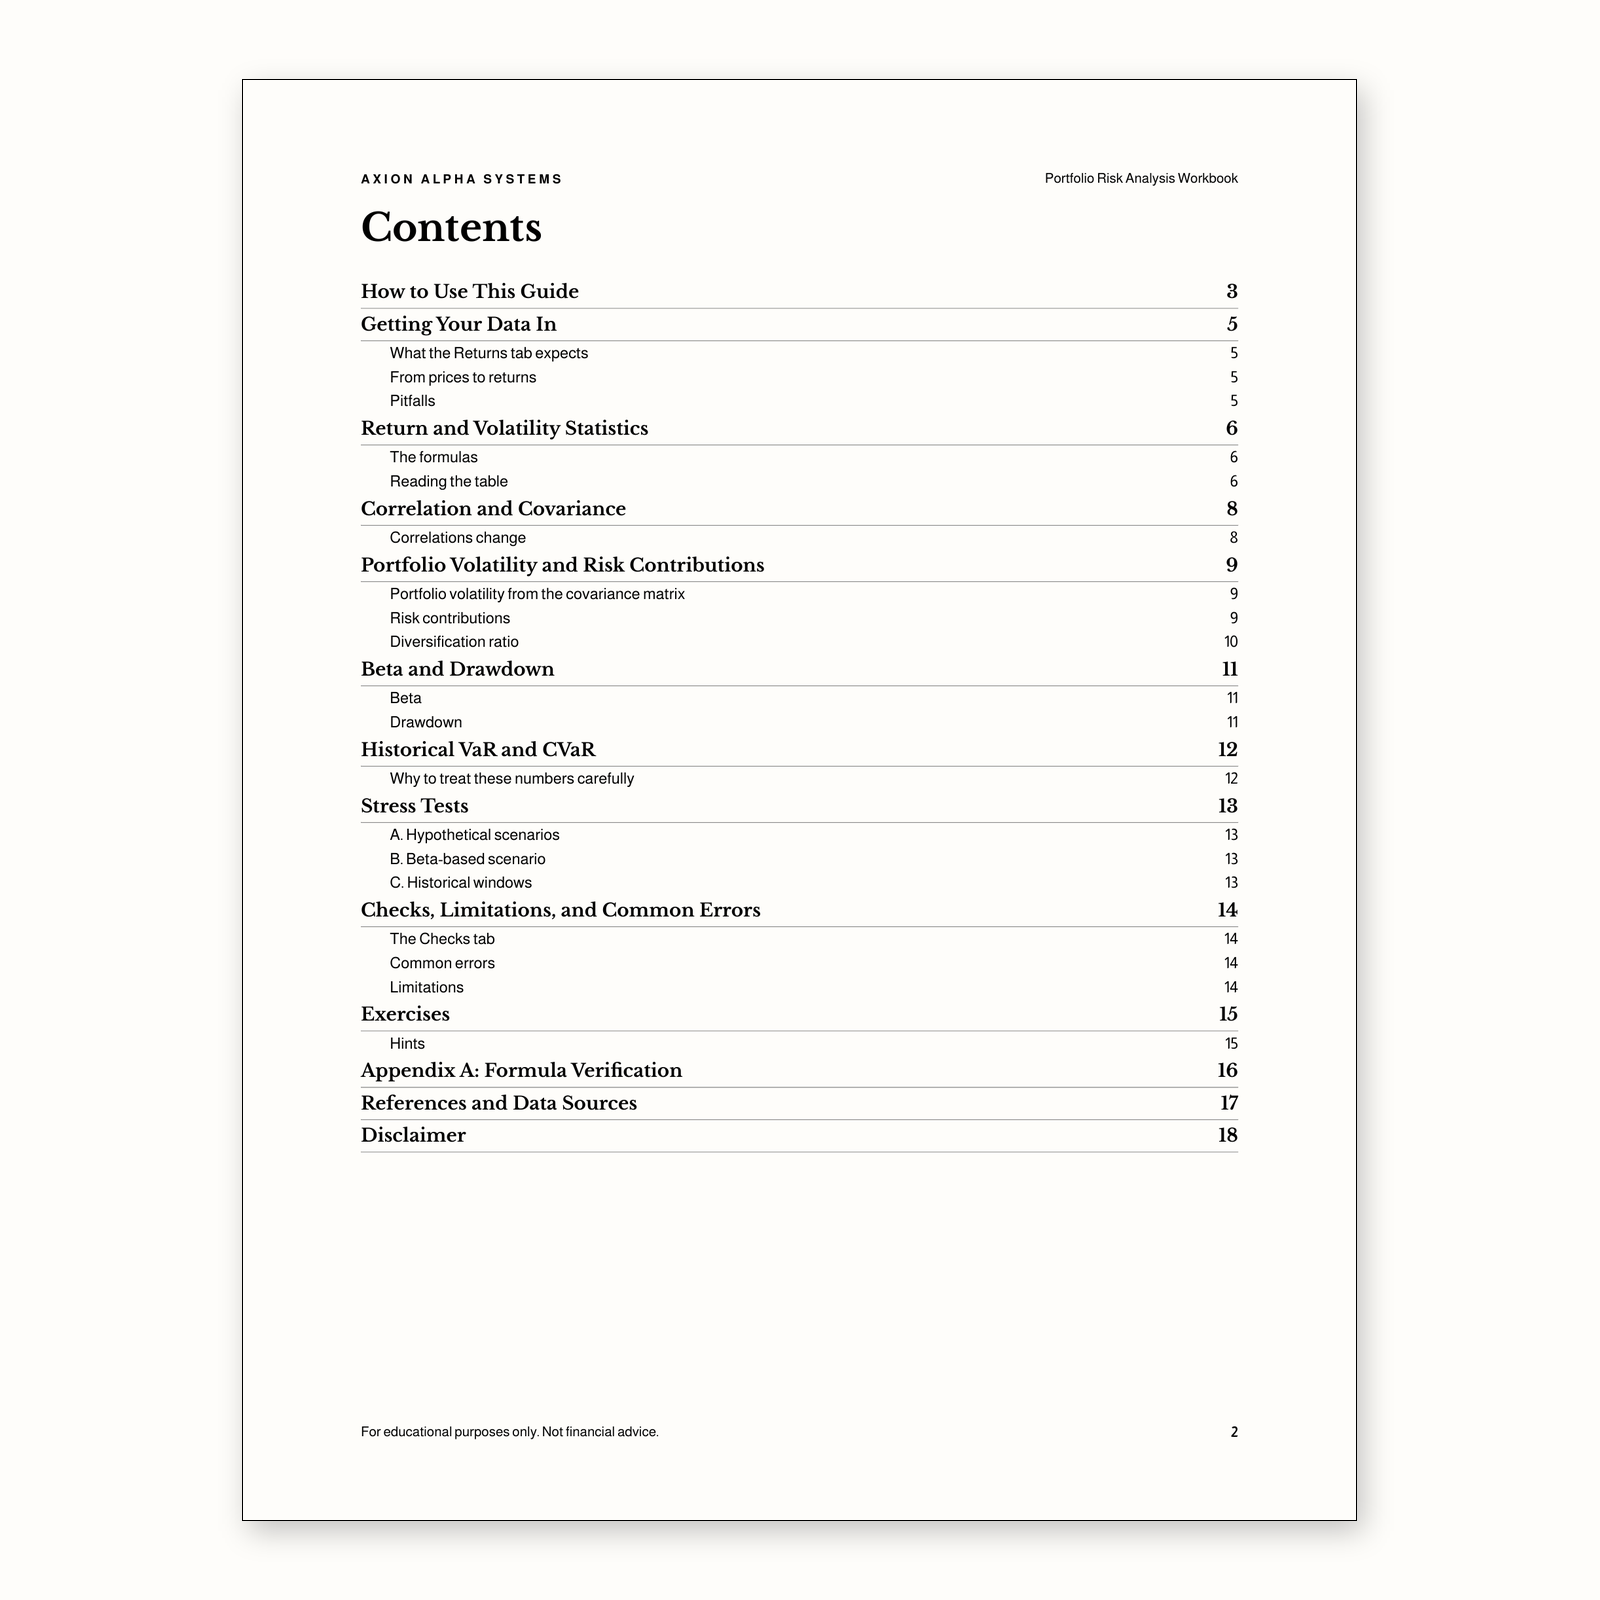 Image 3 of 4
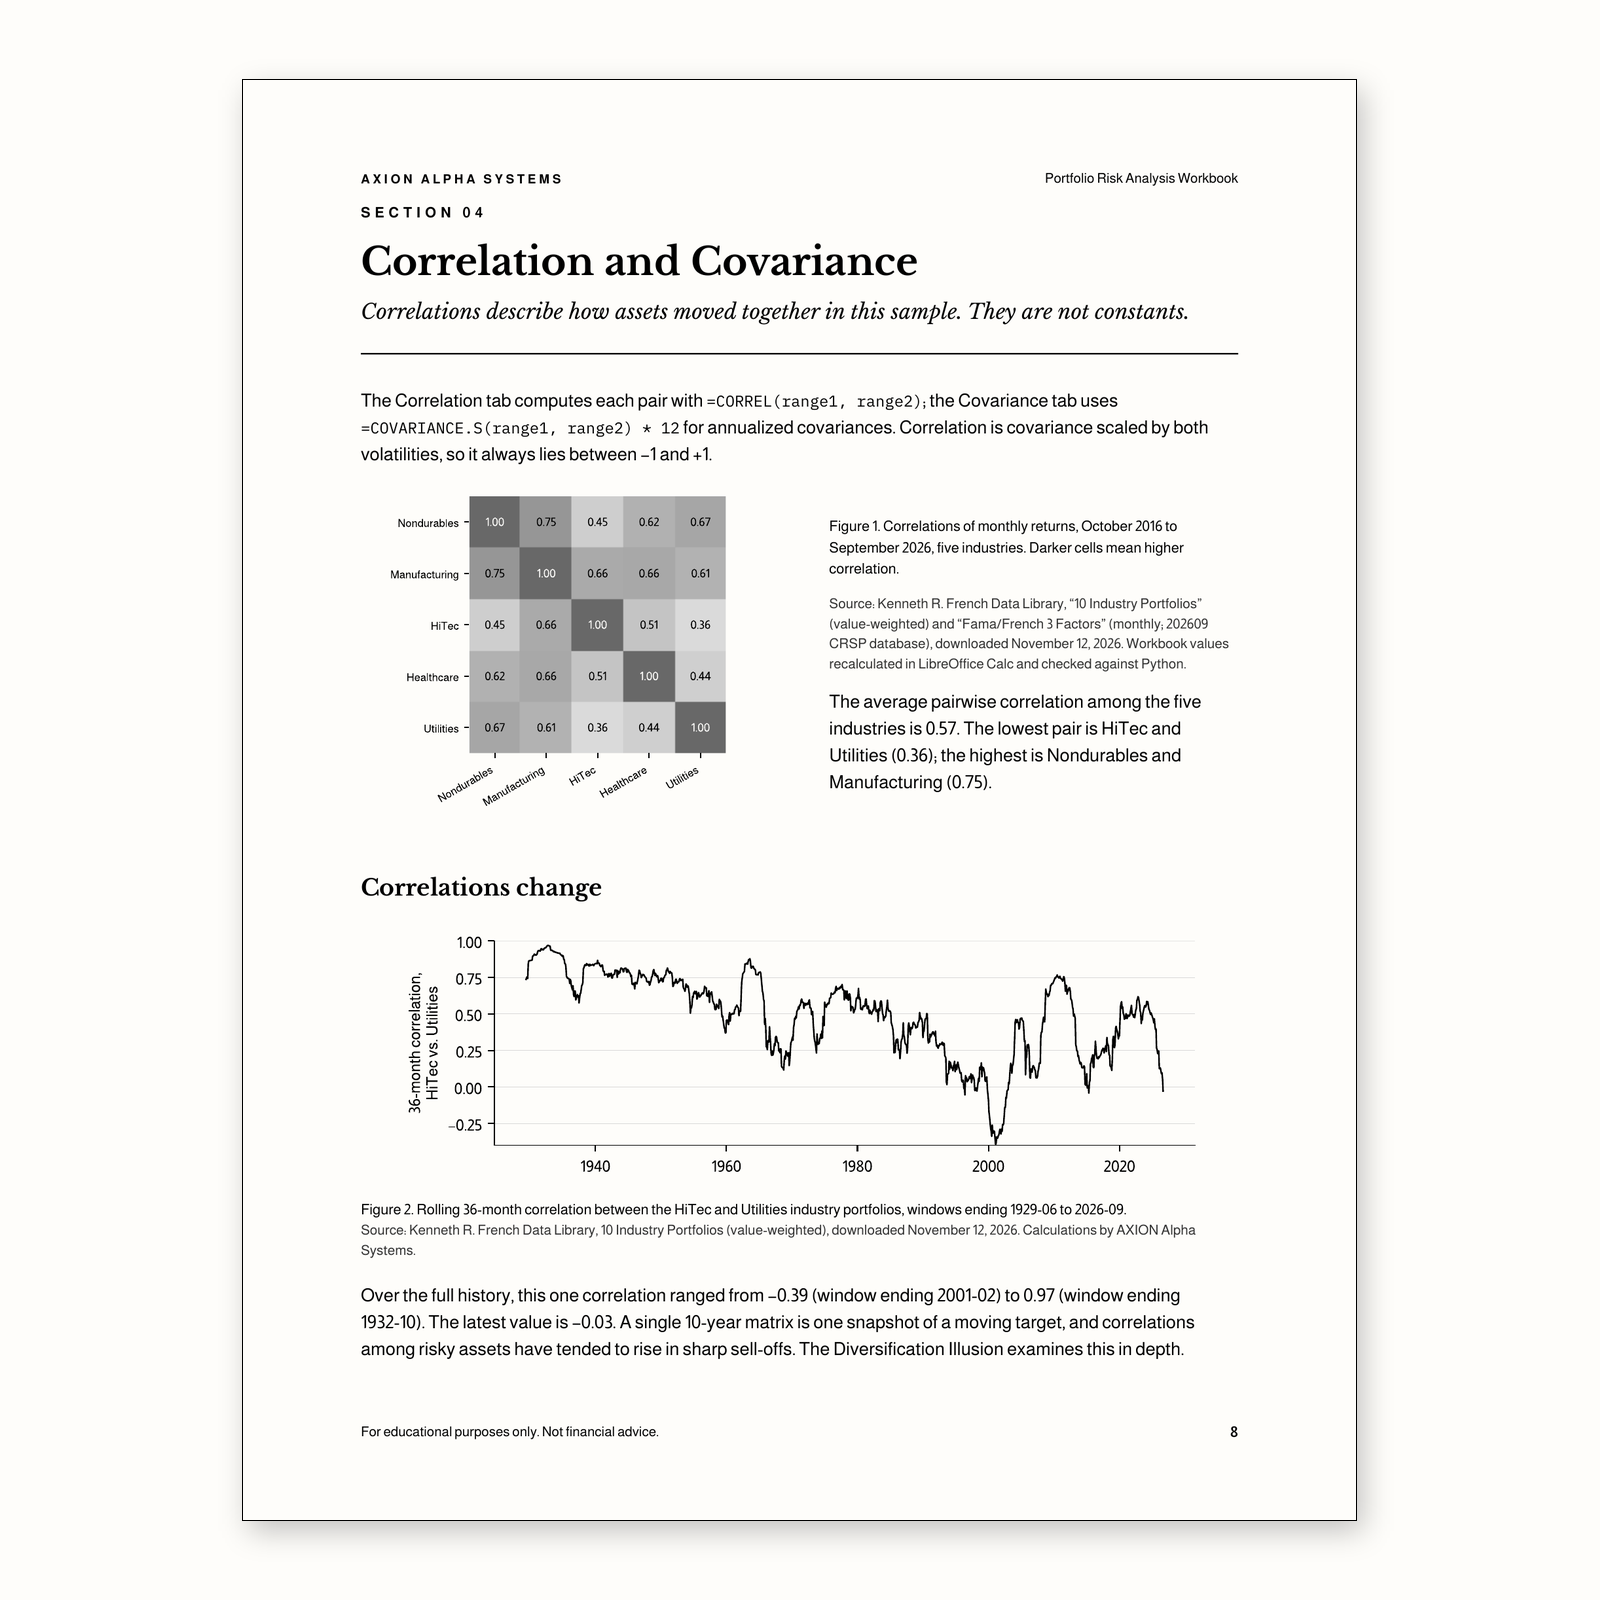 Image 4 of 4
A formula-only spreadsheet (no macros) for analyzing a portfolio’s risk, plus an 18-page PDF guide that explains every tab. Comes loaded with ten years of real monthly data for five U.S. industry portfolios; replace it with your own. Works in Excel, Google Sheets, and LibreOffice.
Inputs tab: weights, risk-free choice, VaR confidence level, and stress shocks, all editable
Returns, excess returns, and growth-of-$1 tabs
Annualized return, volatility, CAGR, Sharpe ratio, skewness, and kurtosis for each asset and the portfolio
Correlation and covariance matrices, portfolio volatility, risk contributions, and the diversification ratio
Beta to the market and maximum drawdown with dates
Historical VaR and CVaR, with guidance on why they deserve caution
Stress tests: hypothetical shocks, a beta-based scenario, and four historical windows
A Checks tab that flags input errors, plus a guide with common errors, limitations, and 6 exercises
Verified: all 3,812 formulas recalculated in LibreOffice and matched an independent Python calculation
Self-directed investors, students, and small-business owners who want to understand the risk in a portfolio using a spreadsheet they can inspect cell by cell.
ZIP download containing the .xlsx workbook (formulas only, no macros) and the PDF guide (18 pages, US Letter). Opens in Excel 2016 or later, Google Sheets, and LibreOffice Calc.
It is not investment advice and does not recommend any allocation. Historical risk statistics describe the past sample only, and a stress test is a scenario, not a forecast.
Will it work in Google Sheets?
Yes. It uses only standard functions and no macros. It was verified in LibreOffice Calc; Excel and Google Sheets were not tested directly.
Where does the example data come from?
Monthly returns, October 2016 to September 2026, for five Fama–French industry portfolios, the U.S. market, and T-bills from the Kenneth R. French Data Library, downloaded November 2026.
Can I use my own funds?
Yes. Paste monthly total returns into the Returns tab; the guide explains how to convert prices to returns and what the Checks tab looks for.
Is this investment advice?
No. It is for educational purposes only.
For educational purposes only. Not financial advice. This product does not recommend any security, fund, or strategy, and nothing in it is a promise of future returns. Historical figures describe the past only.
A formula-only spreadsheet (no macros) for analyzing a portfolio’s risk, plus an 18-page PDF guide that explains every tab. Comes loaded with ten years of real monthly data for five U.S. industry portfolios; replace it with your own. Works in Excel, Google Sheets, and LibreOffice.
Inputs tab: weights, risk-free choice, VaR confidence level, and stress shocks, all editable
Returns, excess returns, and growth-of-$1 tabs
Annualized return, volatility, CAGR, Sharpe ratio, skewness, and kurtosis for each asset and the portfolio
Correlation and covariance matrices, portfolio volatility, risk contributions, and the diversification ratio
Beta to the market and maximum drawdown with dates
Historical VaR and CVaR, with guidance on why they deserve caution
Stress tests: hypothetical shocks, a beta-based scenario, and four historical windows
A Checks tab that flags input errors, plus a guide with common errors, limitations, and 6 exercises
Verified: all 3,812 formulas recalculated in LibreOffice and matched an independent Python calculation
Self-directed investors, students, and small-business owners who want to understand the risk in a portfolio using a spreadsheet they can inspect cell by cell.
ZIP download containing the .xlsx workbook (formulas only, no macros) and the PDF guide (18 pages, US Letter). Opens in Excel 2016 or later, Google Sheets, and LibreOffice Calc.
It is not investment advice and does not recommend any allocation. Historical risk statistics describe the past sample only, and a stress test is a scenario, not a forecast.
Will it work in Google Sheets?
Yes. It uses only standard functions and no macros. It was verified in LibreOffice Calc; Excel and Google Sheets were not tested directly.
Where does the example data come from?
Monthly returns, October 2016 to September 2026, for five Fama–French industry portfolios, the U.S. market, and T-bills from the Kenneth R. French Data Library, downloaded November 2026.
Can I use my own funds?
Yes. Paste monthly total returns into the Returns tab; the guide explains how to convert prices to returns and what the Checks tab looks for.
Is this investment advice?
No. It is for educational purposes only.
For educational purposes only. Not financial advice. This product does not recommend any security, fund, or strategy, and nothing in it is a promise of future returns. Historical figures describe the past only.