
 Image 1 of 4
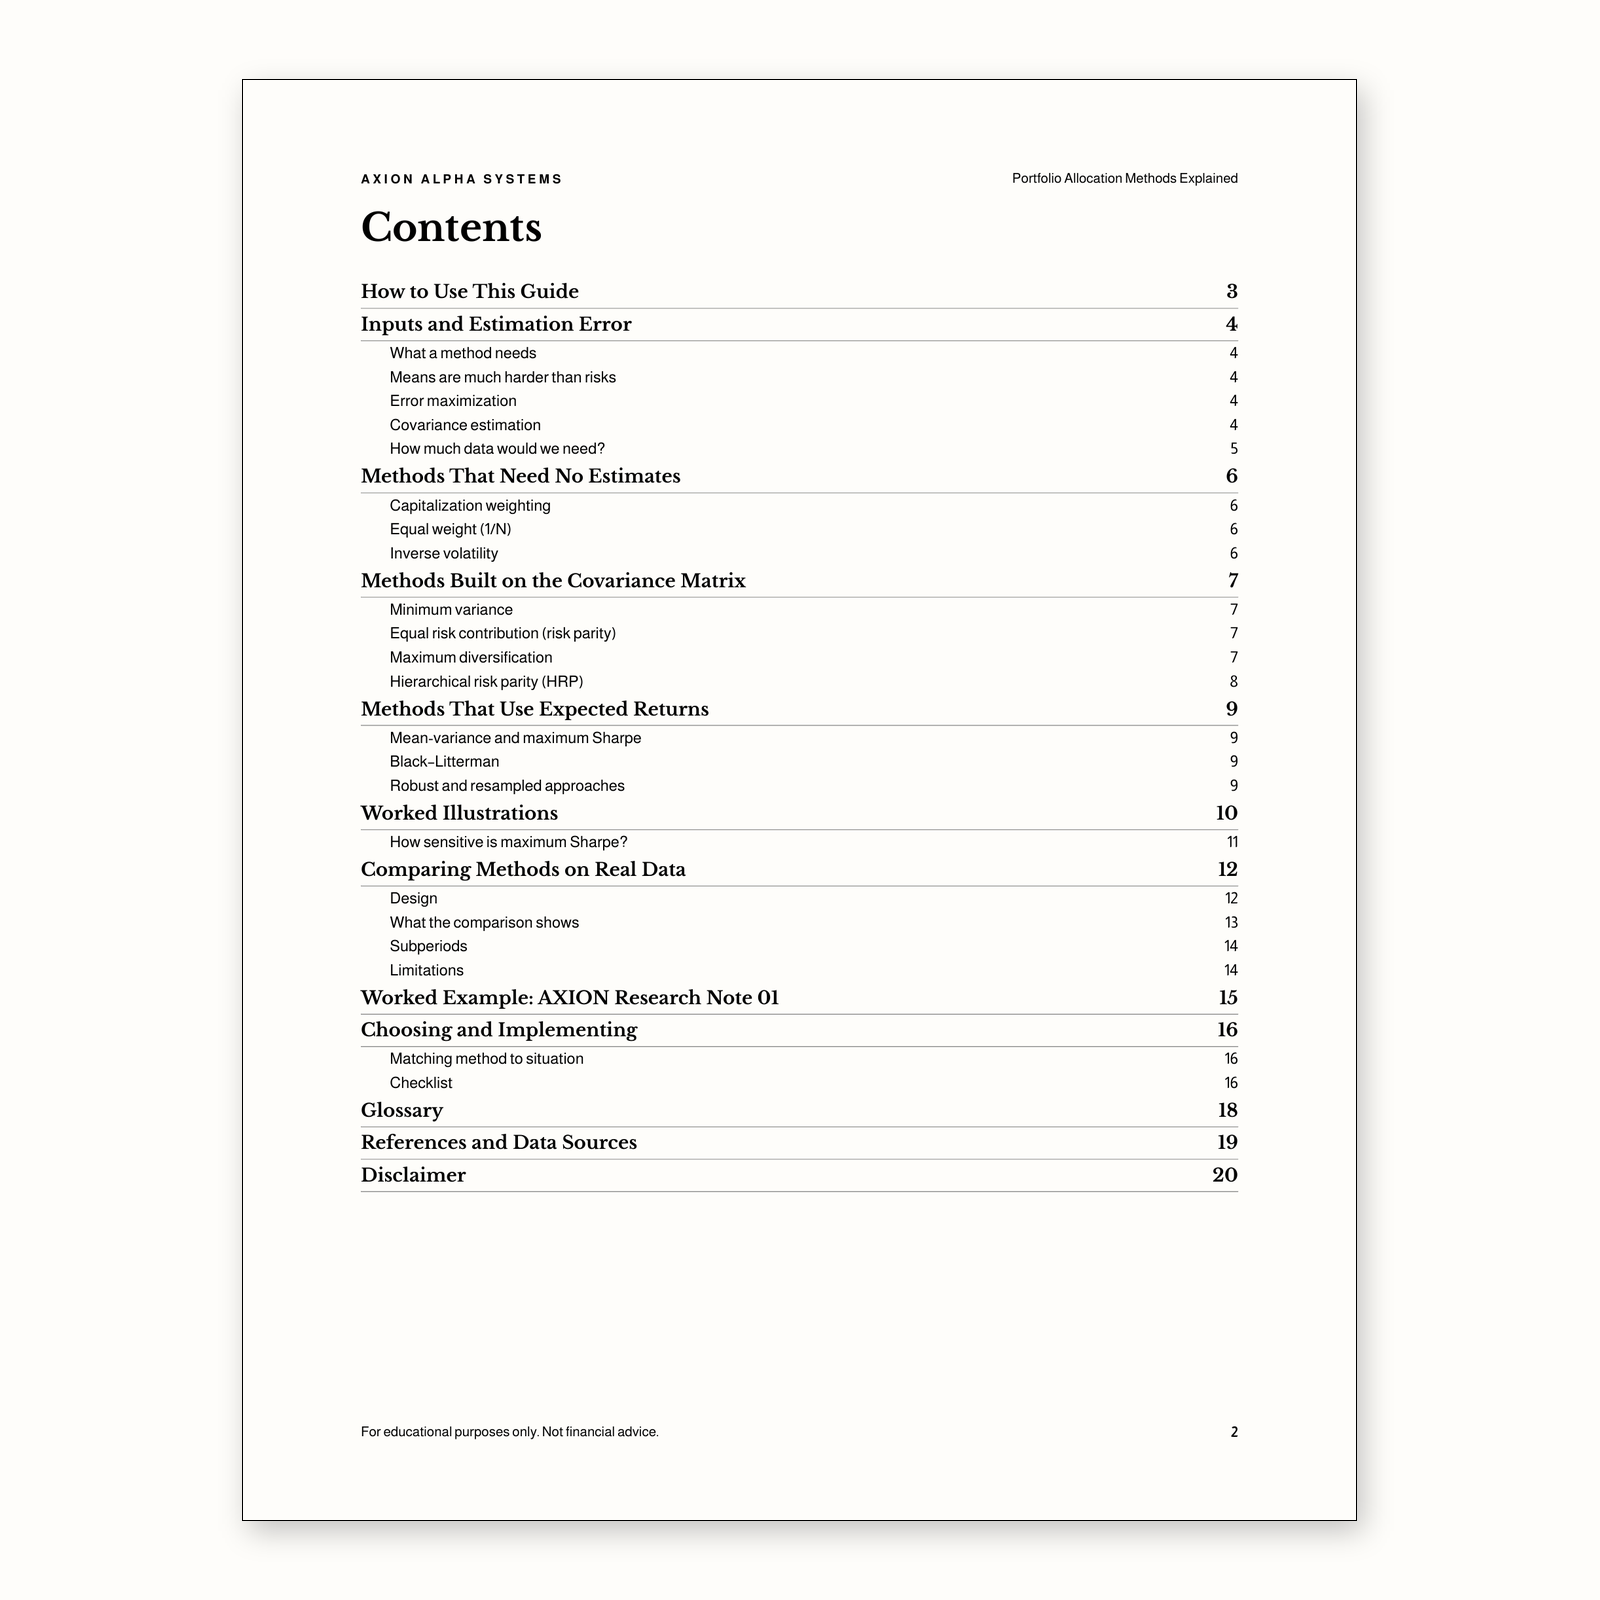 Image 2 of 4
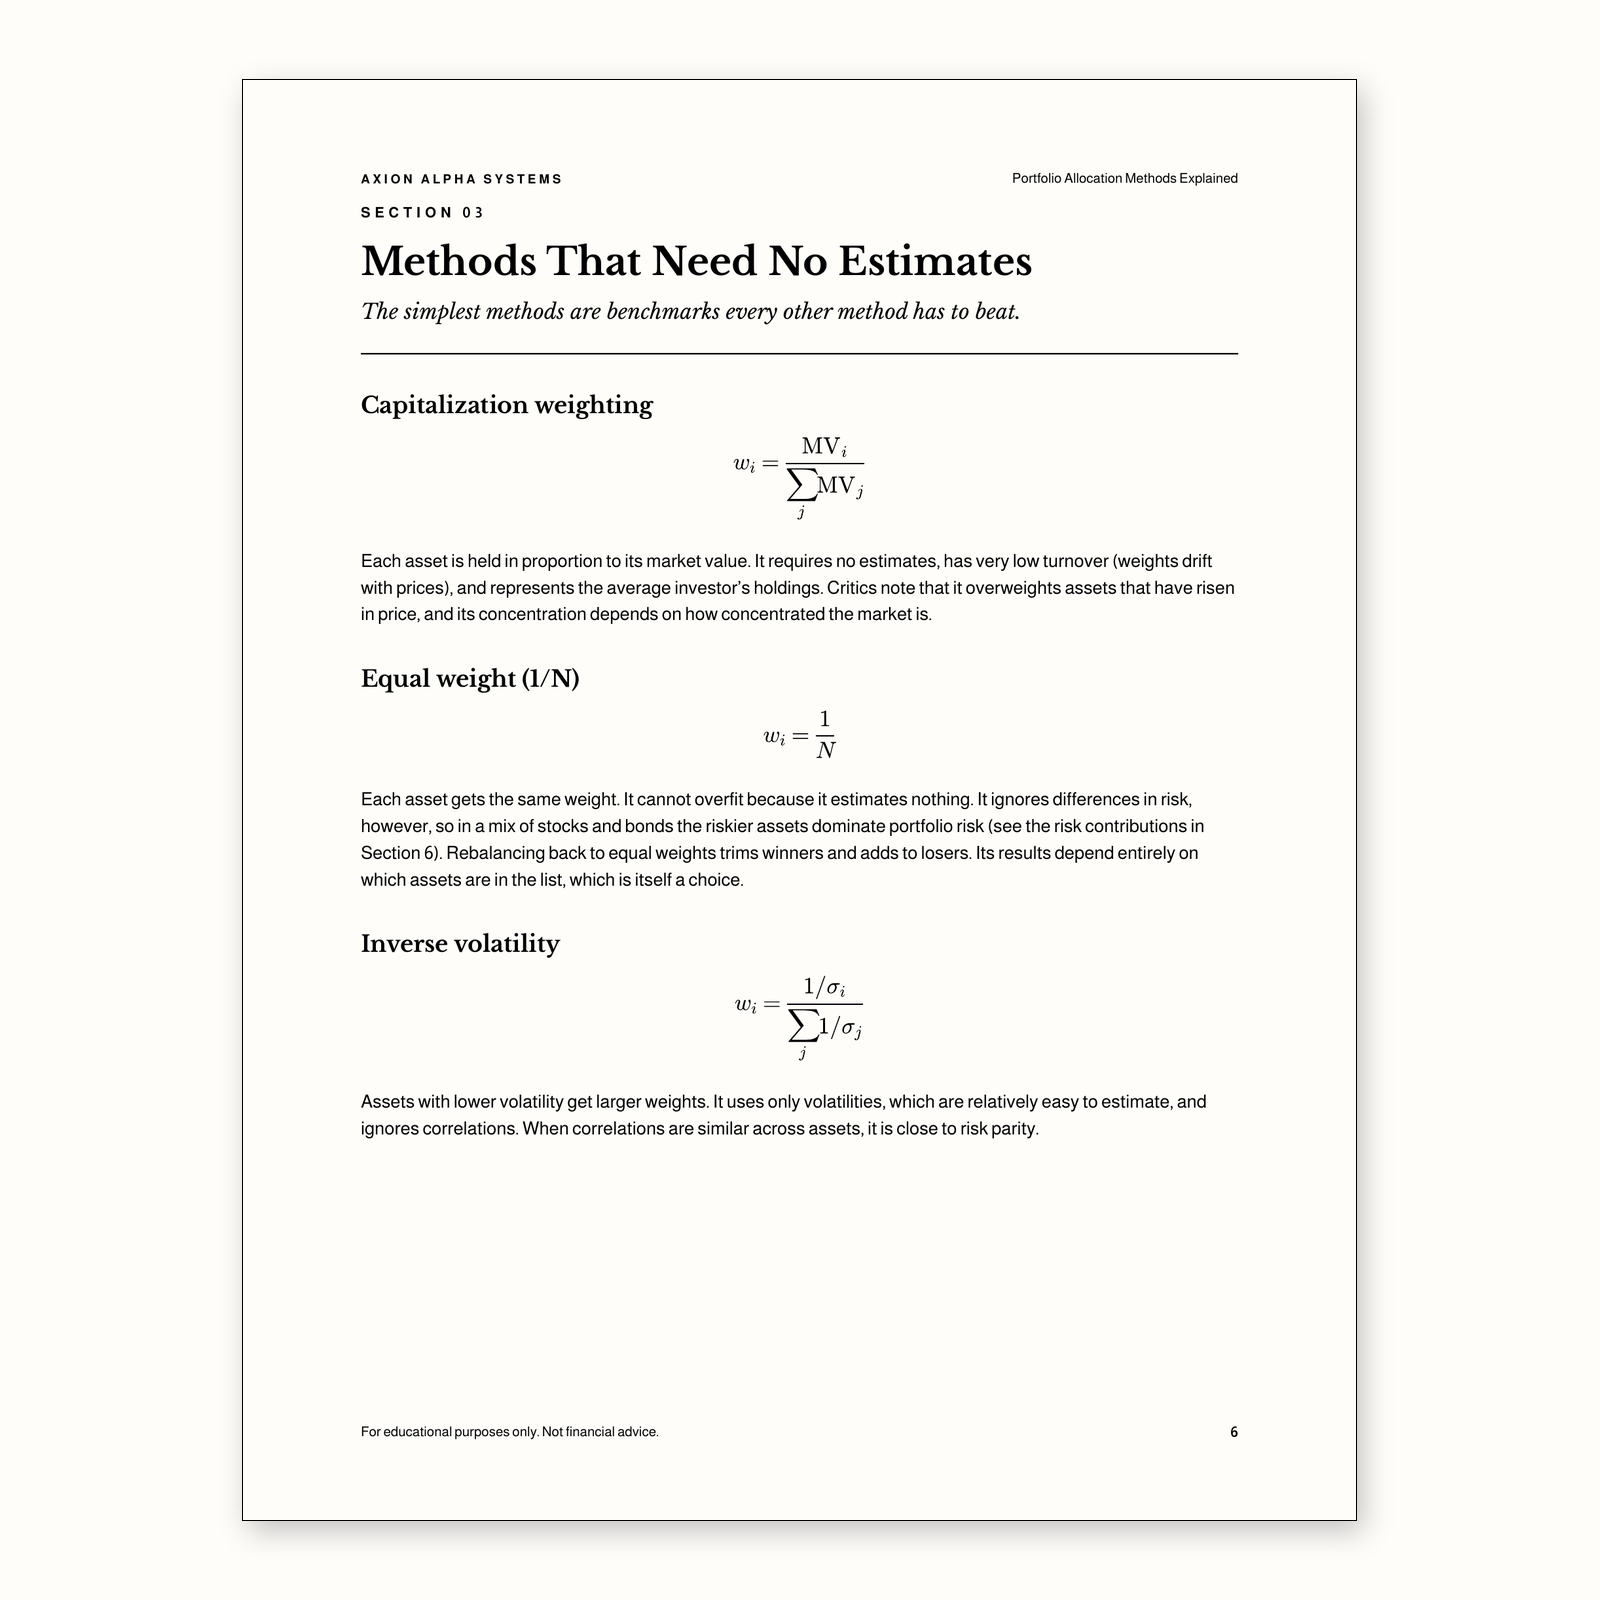 Image 3 of 4
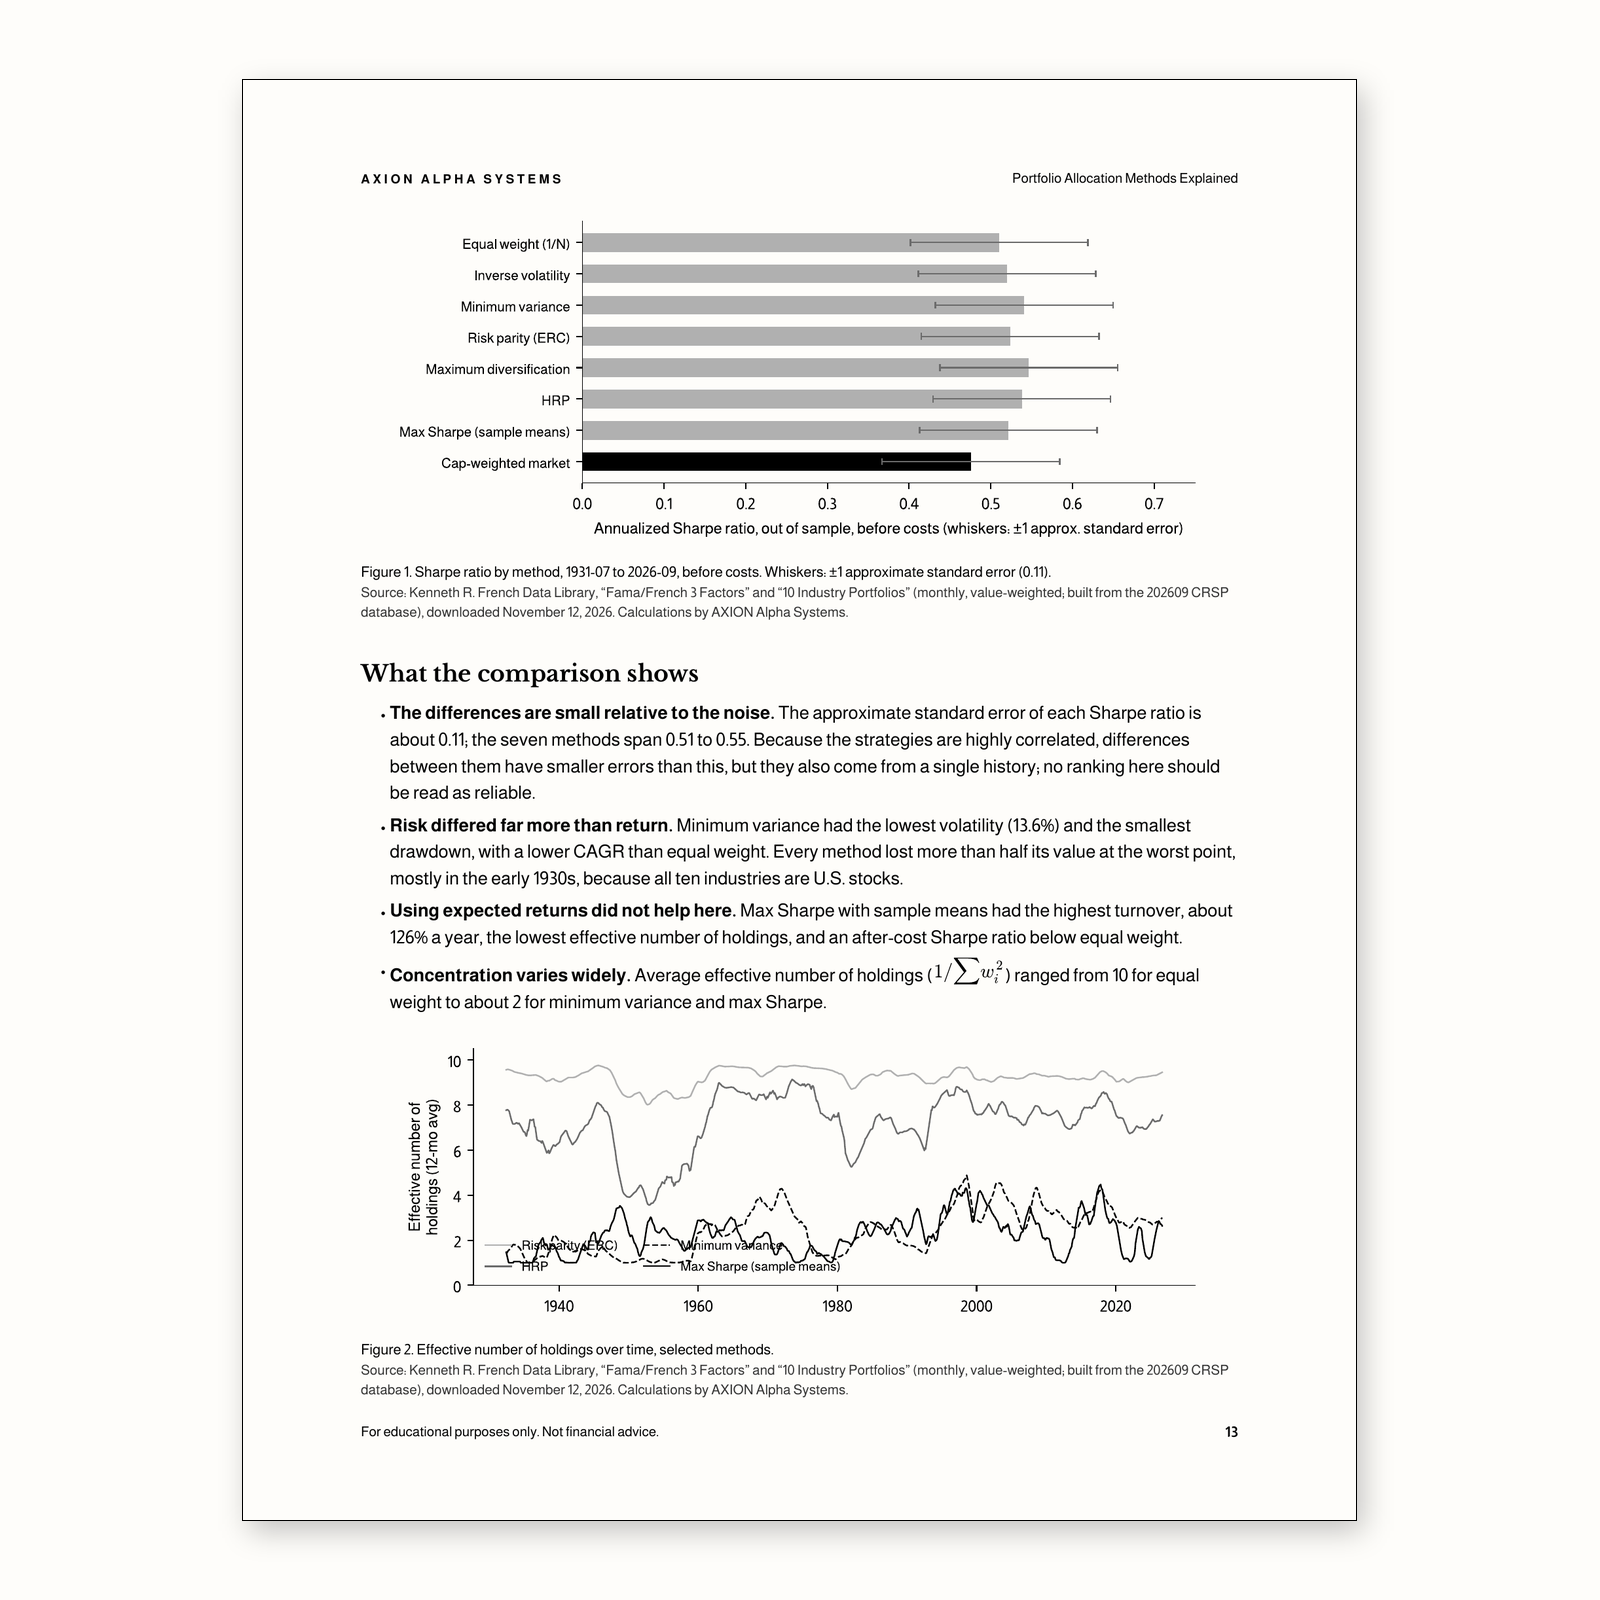 Image 4 of 4
A 20-page PDF explaining the main portfolio allocation methods, what each assumes, and how estimation error drives their results, with a walk-forward comparison on 95 years of U.S. industry data. Includes a checklist and worksheet.
Inputs and estimation error: why expected returns are the noisiest input, and shrinkage and constraints as remedies
Cap weighting, equal weight (1/N), and inverse volatility
Minimum variance, equal risk contribution (risk parity), maximum diversification, and hierarchical risk parity (HRP), with formulas
Mean-variance, maximum Sharpe, and Black–Litterman
Worked illustrations with example data, including how a half-point change in expected returns swings a max-Sharpe portfolio
A walk-forward comparison of seven methods on 10 U.S. industry portfolios, 1931–2026, with turnover, costs, concentration, subperiods, and standard errors
AXION Research Note 01 as a worked example of a complex method that failed its pre-registered test
A method-selection table, 12-point checklist, worksheet, glossary, and references
Students, self-directed investors, and analysts who want to understand how portfolio construction methods work and how to compare them fairly. Familiarity with volatility and correlation helps; AXION’s Quantitative Finance Foundations covers the basics.
PDF, 20 pages, US Letter. Instant download. Includes a printable worksheet.
It is not investment advice and does not recommend any method, allocation, or fund. The real-data comparison is one historical sample of U.S. equities, and no method in it is presented as validated.
Which method is best?
The guide does not name one. On its real-data test the differences between methods were small relative to statistical noise, and rankings changed between subperiods.
Where does the data come from?
The Kenneth R. French Data Library: 10 value-weighted U.S. industry portfolios and the Fama–French factors, September 2026 CRSP build, downloaded November 2026.
Does it include code?
No. Formulas and steps are given so you can implement the methods in any tool.
Is this investment advice?
No. It is for educational purposes only.
For educational purposes only. Not financial advice. This guide does not recommend any security, fund, or strategy, and nothing in it is a promise of future returns. Historical figures describe the past only.
A 20-page PDF explaining the main portfolio allocation methods, what each assumes, and how estimation error drives their results, with a walk-forward comparison on 95 years of U.S. industry data. Includes a checklist and worksheet.
Inputs and estimation error: why expected returns are the noisiest input, and shrinkage and constraints as remedies
Cap weighting, equal weight (1/N), and inverse volatility
Minimum variance, equal risk contribution (risk parity), maximum diversification, and hierarchical risk parity (HRP), with formulas
Mean-variance, maximum Sharpe, and Black–Litterman
Worked illustrations with example data, including how a half-point change in expected returns swings a max-Sharpe portfolio
A walk-forward comparison of seven methods on 10 U.S. industry portfolios, 1931–2026, with turnover, costs, concentration, subperiods, and standard errors
AXION Research Note 01 as a worked example of a complex method that failed its pre-registered test
A method-selection table, 12-point checklist, worksheet, glossary, and references
Students, self-directed investors, and analysts who want to understand how portfolio construction methods work and how to compare them fairly. Familiarity with volatility and correlation helps; AXION’s Quantitative Finance Foundations covers the basics.
PDF, 20 pages, US Letter. Instant download. Includes a printable worksheet.
It is not investment advice and does not recommend any method, allocation, or fund. The real-data comparison is one historical sample of U.S. equities, and no method in it is presented as validated.
Which method is best?
The guide does not name one. On its real-data test the differences between methods were small relative to statistical noise, and rankings changed between subperiods.
Where does the data come from?
The Kenneth R. French Data Library: 10 value-weighted U.S. industry portfolios and the Fama–French factors, September 2026 CRSP build, downloaded November 2026.
Does it include code?
No. Formulas and steps are given so you can implement the methods in any tool.
Is this investment advice?
No. It is for educational purposes only.
For educational purposes only. Not financial advice. This guide does not recommend any security, fund, or strategy, and nothing in it is a promise of future returns. Historical figures describe the past only.