
When Bonds Stop Hedging
Stock–bond correlation regimes in U.S. data, 1926–2026
AXION Research Note No. 2 · Drafted November 13, 2026 · Analysis plan frozen November 13, 2026, before any stock–bond statistic was computed (SHA-256 1cc1ecd2c66457eb…) (America/Denver)
Summary
Note 01 tested a strategy built on the fear that diversification fails when assets start moving together. Its holdout, 1996–2006, never contained the case that matters most for a stock/bond portfolio: stocks and bonds falling at the same time, as they did in 2022. This note steps back and describes, with a century of free public data, how often U.S. stocks and 10-year Treasuries have moved together, how that lines up with inflation, and what it did to a 60/40 portfolio. It is descriptive. It proposes no timing rule and tests none.
The data partly contradict the framing in our own title. “When bonds stop hedging” implies hedging is the normal state. It was not. The 36-month stock–bond correlation was positive in 59% of all months since 1929 (between 54% and 64% across every variant we pre-registered). The negative correlation investors grew used to, from Nov 2000 to Jul 2022, was the longest negative stretch in the record: 261 months, against 55 for the next longest. Since Aug 2022 the correlation has been positive again; it reached 0.66 in Dec 2024 and stood at 0.41 at the end of our data (Sep 2026).
Positive correlation lined up with higher inflation: across 33 non-overlapping three-year blocks the rank correlation was 0.62, and in years with inflation of 3% or more the average daily stock–bond correlation was +0.19, against −0.12 in lower-inflation years. In the worst tenth of stock months, bonds earned +0.85% a month above cash when the trailing correlation had been negative, and −0.48% when it had been positive. But three of the four deepest nominal 60/40 losses — 1929–32, 1937–38, 2007–09 — happened while bonds were hedging; they were stock crashes. Positive correlation shows up mainly in real (after-inflation) losses: 1973–74, 1946–48, and 2022.
2022 was the 10-year Treasury’s worst calendar year in this record (−16.5%; −21.5% after inflation), stocks returned −19.9%, and a 60/40 mix lost 18.2%, or 23.1% after inflation — the second-worst real year since 1927, essentially tied with 1937 and behind only 1974.
The question
A 60/40 portfolio relies on bonds to cushion stock losses. That cushion depends on the correlation between stock and bond returns — the tendency of the two to move in the same direction. When it is negative, bonds tend to rise as stocks fall. When it is positive, both can fall together and the portfolio behaves more like one bet: the concern behind Note 01.
We asked four questions, written down in advance: (1) How often, and for how long, has the U.S. stock–bond correlation been positive since 1926? (2) Does it line up with inflation? (3) Did bonds help in bad stock months, and did that depend on the correlation regime going in? (4) What happened to a 60/40 portfolio in its worst episodes, including 2022? We already knew the broad shape from published work — positive correlation in much of the 1970s–1990s, negative from about 2000 (Ilmanen, 2003; Baele, Bekaert, and Inghelbrecht, 2010; Campbell, Sunderam, and Viceira, 2017) — so this is not a blind test. Its value is a long, reproducible record on free data, with the 2022–2026 period included.
How we measured it
Pre-registration. We wrote the full list of statistics and every variant into an analysis plan and recorded its SHA-256 hash (1cc1ecd2c66457eb7fad042bf90482b2f30fb1a419fb6623f3834e96b55153e6) before computing any stock–bond statistic. Six variants (eight settings) are reported below; none was chosen after seeing results. Two deviations, both made before results were seen, are disclosed under Limitations.
Stocks. The U.S. market return from the Ken French Data Library (Mkt−RF plus RF), monthly from July 1926 and daily from 1926, through September 2026. Cash is the French one-month T-bill return (RF).
Bonds. No free source in our set offers a traded U.S. Treasury return index back to 1926, so every bond return here is rebuilt from yields: a 10-year par bond, bought at the start of each period and repriced at the next period’s yield, using the formula in Robert Shiller’s public data file. We checked our code against Shiller’s own column: over 857 overlapping months the two agree to within 0.04 percentage points except in three months where Shiller’s yield input differs from FRED’s GS10 (June–July 2019, which looks like a one-month shift in his file, and September 2024, where he used an early-month value).
- Primary series. July 1926 to January 1962: Shiller’s returns, which use monthly-average yields. February 1962 onward: the same formula on FRED’s month-end DGS10 yield, which lines up exactly with month-end stock returns. Because average yields blur timing, the pre-1962 series was aligned by comparing it with the month-end series on 1962–2024 bond data only (correlation 0.73 with a one-month shift versus 0.62 without); stock returns were not used for that choice.
- Daily. The same repricing on daily DGS10 yields from 1962, matched to French daily stock returns on common trading days (January 1962 to September 2026, 16128 days).
- Inflation. CPI: Shiller’s CPI before 1947, FRED CPIAUCSL from 1947. The October 2025 CPI value is missing from FRED; we filled it by geometric interpolation.
Correlations use monthly (or daily) returns in excess of cash. Rolling 36-month correlations overlap, so we do not attach significance tests to them; where we report a test, it uses non-overlapping data. The 60/40 portfolio is rebalanced monthly with no costs, fees, or taxes.
Results
1. Positive correlation was the norm, not the exception
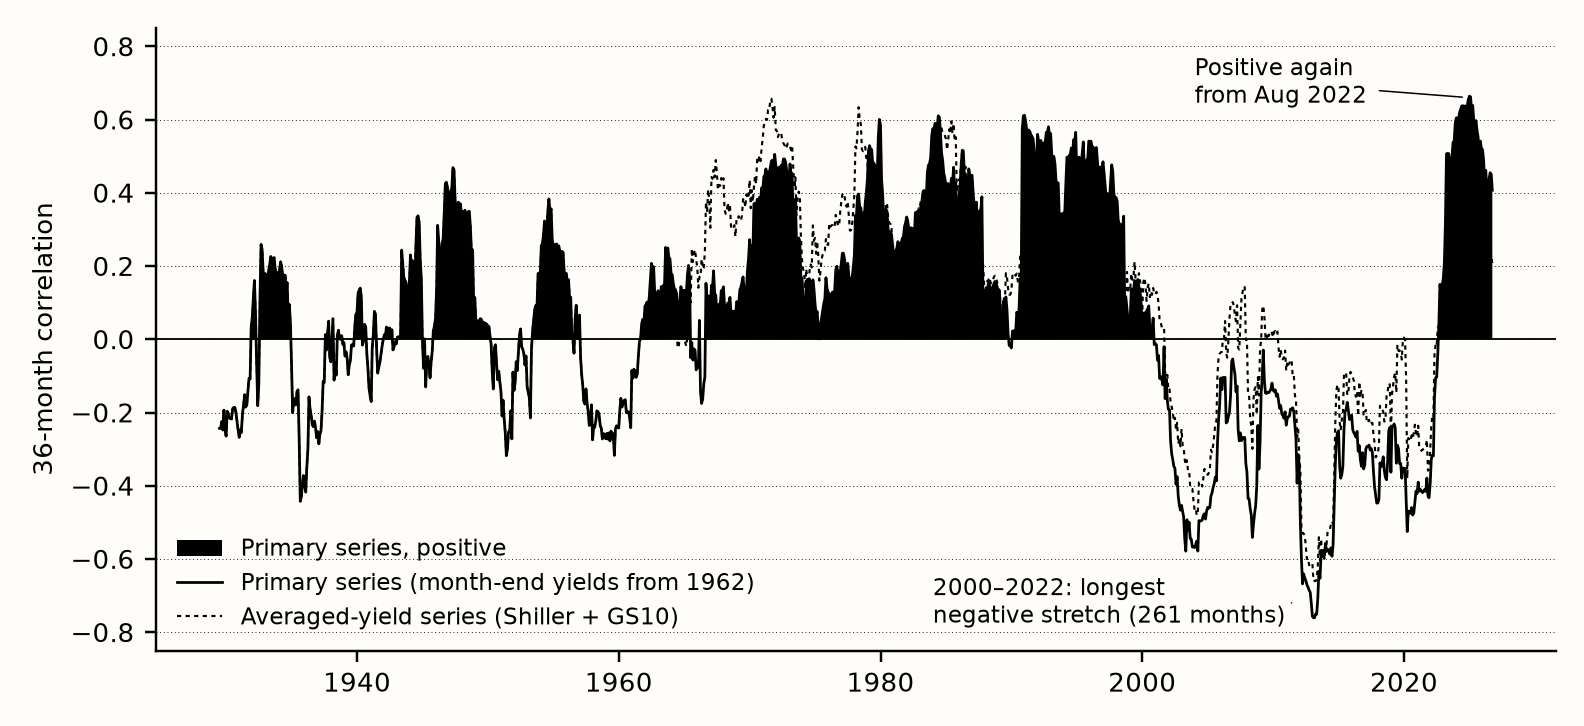
Figure 1. Rolling 36-month correlation between monthly U.S. stock and 10-year Treasury excess returns. Solid line and fill: primary series (filled where positive). Dashed: averaged-yield series.
Sources: Kenneth R. French Data Library (Fama/French 3 Factors, 202609 CRSP build); Robert J. Shiller, ie_data.xls; FRED series DGS10, GS10, CPIAUCSL; all downloaded November 13, 2026. Bond returns are rebuilt from 10-year Treasury yields. Calculations by AXION Alpha Systems.
| Sign | Spell (36-month correlation, runs of 12 months or more) | Months |
|---|---|---|
| Negative | Jun 1929 – Oct 1931 | 29 |
| Positive | Jul 1932 – Nov 1934 | 29 |
| Negative | Dec 1934 – Jun 1937 | 31 |
| Positive | Jan 1943 – Nov 1944 | 23 |
| Positive | Oct 1945 – Feb 1950 | 53 |
| Negative | Mar 1950 – Apr 1952 | 26 |
| Positive | May 1953 – May 1956 | 37 |
| Negative | Jan 1957 – Jul 1961 | 55 |
| Positive | Aug 1961 – May 1965 | 46 |
| Positive | Aug 1966 – Sep 1989 | 278 |
| Positive | Jan 1990 – Oct 2000 | 130 |
| Negative | Nov 2000 – Jul 2022 | 261 |
| Positive | Aug 2022 – Sep 2026 | 50 |
Gaps between listed spells are periods when the sign flipped back and forth with no run of 12 months. Lowest reading −0.76 (Feb 2013); highest 0.66 (Dec 2024). In the averaged-yield series the highest reading is in 1971 and the post-2022 peak is lower (0.49 in December 2024), so “highest on record” is not a robust claim; “comparable to the 1970s–1990s” is.
2. It lined up with inflation, loosely
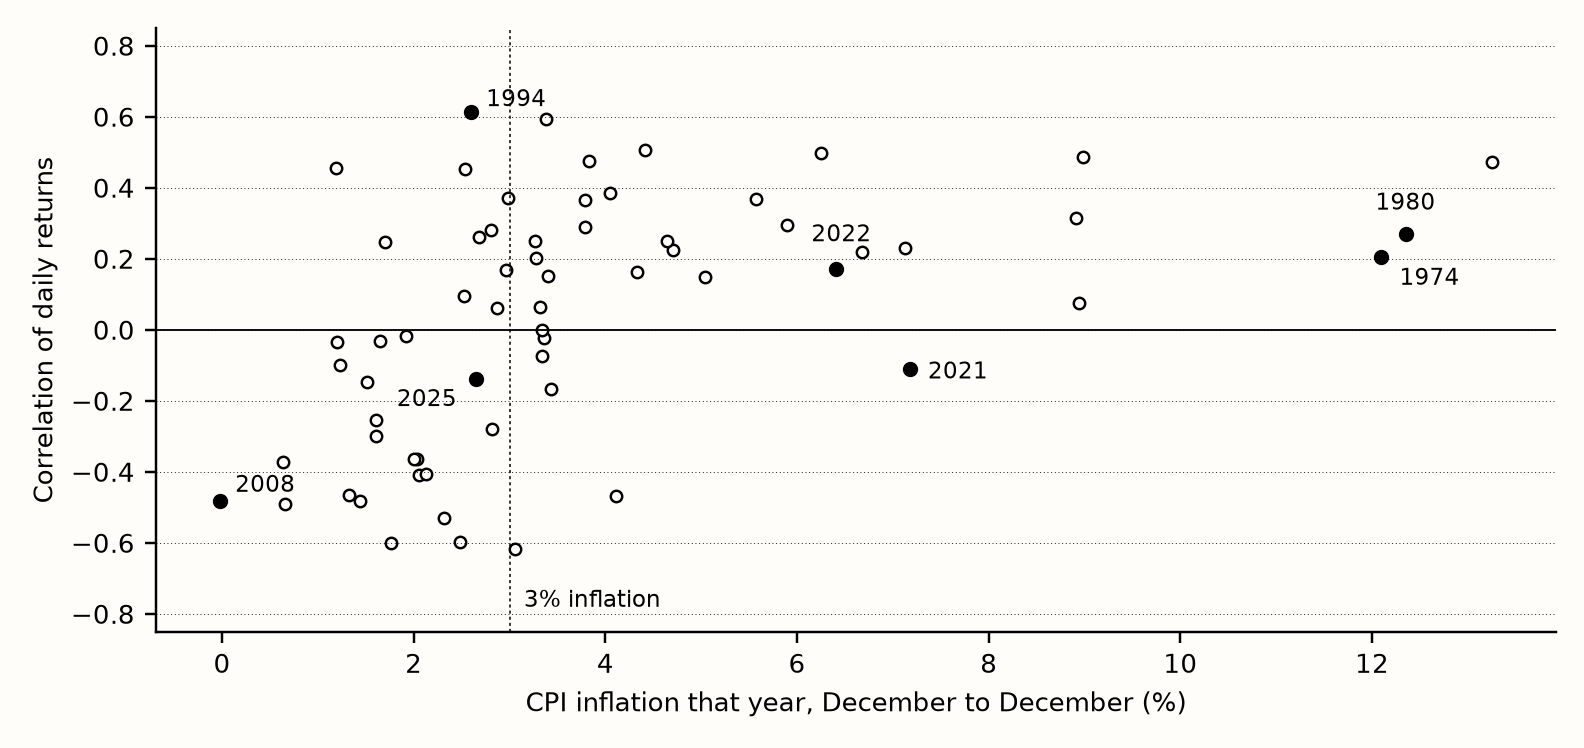
Figure 2. Each point is one calendar year, 1962–2025: the correlation of daily stock and bond excess returns that year against that year’s CPI inflation.
Sources: Kenneth R. French Data Library (Fama/French 3 Factors, 202609 CRSP build); Robert J. Shiller, ie_data.xls; FRED series DGS10, GS10, CPIAUCSL; all downloaded November 13, 2026. Bond returns are rebuilt from 10-year Treasury yields. Calculations by AXION Alpha Systems.
| Measure | Value |
|---|---|
| Three-year blocks, 1926–2025: rank correlation of block correlation with block inflation (33 blocks) | 0.62 (p = 0.0001) |
| Calendar years 1962–2025: rank correlation of daily correlation with inflation (64 years) | 0.55 (p = 0.000002) |
| Average daily correlation, inflation ≥ 3% (33 years) / < 3% (31 years) | +0.19 / −0.12 |
| Share of years with positive correlation, inflation ≥ 3% / < 3% | 79% / 32% |
| Same split at 2.5% / 4% thresholds: average correlation high / low | +0.19 / −0.27; +0.24 / −0.05 |
The association is clear but loose, and it is not a forecast. 2021 had 7.2% inflation and a negative correlation; most of the 1990s had inflation under 3% and a strongly positive one. The p-values overstate certainty: the blocks and years are autocorrelated, and the whole pattern rests on a handful of long regimes (essentially the 1970s–1990s versus 2000–2021). Published work also finds that inflation and other macroeconomic variables explain only part of the movement (Baele, Bekaert, and Inghelbrecht, 2010).
3. Bonds helped in bad stock months — when the correlation had been negative
| Worst 10% of stock months (stock excess return ≤ −5.3%) | Months | Avg. stock excess | Avg. bond excess | Bonds up |
|---|---|---|---|---|
| All | 121 | — | +0.16% | 63% |
| Trailing 36-month correlation negative going in | 58 | −9.1% | +0.85% | 67% |
| Trailing 36-month correlation positive going in | 62 | −9.2% | −0.48% | 58% |
Across all bad stock months, bonds earned about what they earn on average (+0.13% a month): no special cushion. The split by regime is large in economic terms but rests on about 60 months each, clustered in a few episodes. It is a description of the past, not a signal: Note 01 is a reminder that acting on correlation readings can subtract value.
4. The worst 60/40 losses: stock crashes in nominal terms, inflation in real terms
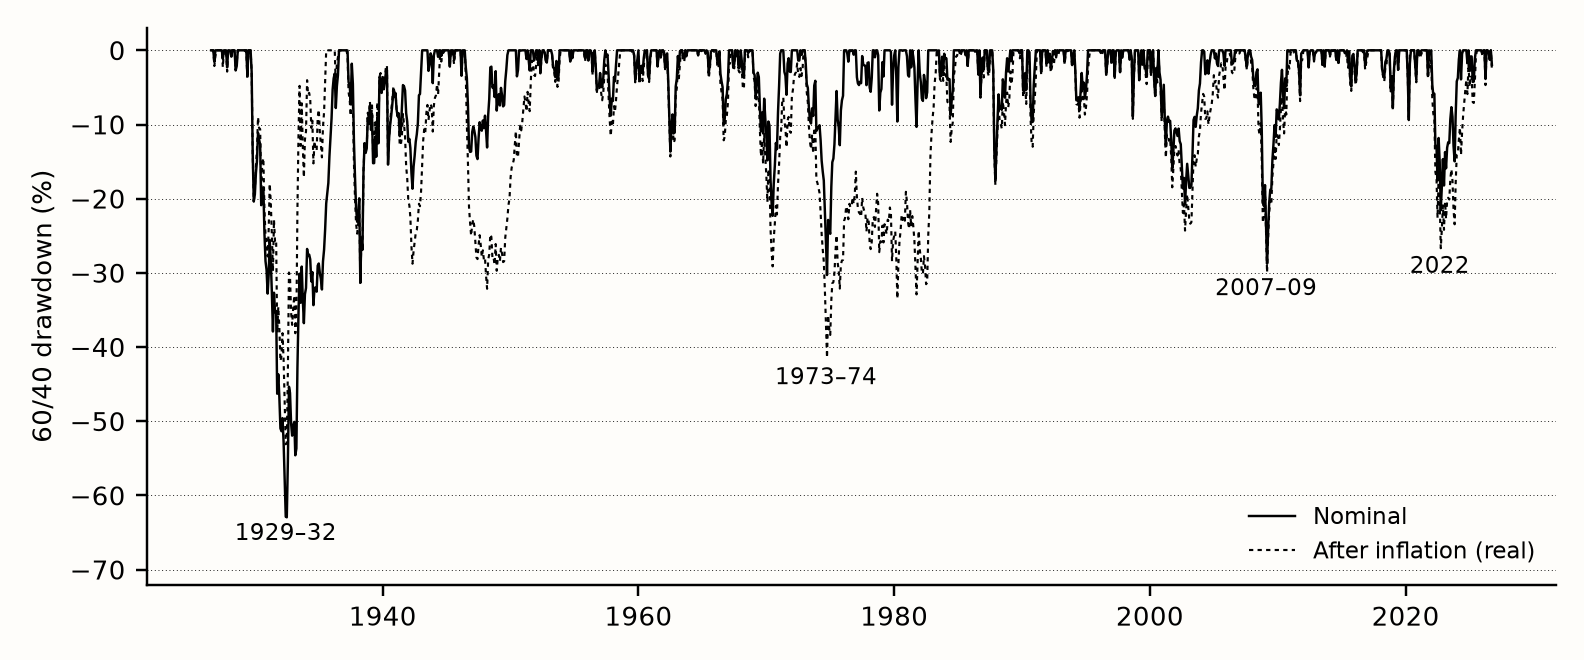
Figure 3. Drawdown (decline from the previous peak) of a 60% stock / 40% 10-year Treasury portfolio, rebalanced monthly, before and after inflation.
Sources: Kenneth R. French Data Library (Fama/French 3 Factors, 202609 CRSP build); Robert J. Shiller, ie_data.xls; FRED series DGS10, GS10, CPIAUCSL; all downloaded November 13, 2026. Bond returns are rebuilt from 10-year Treasury yields. Calculations by AXION Alpha Systems.
| Five deepest nominal drawdowns (peak – trough) | Depth | Stocks | Bonds | 36-m corr. at trough |
|---|---|---|---|---|
| Aug 1929 – Jun 1932 | −62.9% | −83.7% | 9.2% | −0.12 |
| Feb 1937 – Mar 1938 | −31.3% | −49.5% | 4.2% | −0.11 |
| Dec 1972 – Sep 1974 | −30.3% | −46.5% | 1.5% | +0.04 |
| Oct 2007 – Feb 2009 | −28.8% | −50.3% | 17.9% | −0.11 |
| Nov 1968 – Jun 1970 | −22.3% | −33.6% | −3.0% | +0.35 |
| Five deepest real drawdowns (peak – trough) | Depth | Stocks | Bonds, real | 36-m corr. at trough |
|---|---|---|---|---|
| Aug 1929 – May 1932 | −53.1% | −83.5% | 37.1% | −0.18 |
| Dec 1972 – Sep 1974 | −41.4% | −46.5% | −14.7% | +0.04 |
| May 1946 – Feb 1948 | −32.1% | −22.5% | −20.3% | +0.28 |
| Feb 1937 – Mar 1938 | −31.3% | −49.5% | 4.2% | −0.11 |
| Oct 2007 – Feb 2009 | −30.0% | −50.3% | 16.0% | −0.11 |
The nominal losses of 1929–32, 1937–38, and 2007–09 came while bonds were rising: the correlation was negative and bonds gained 9.2%, 4.2%, and 17.9% — the damage came from stocks. The third-deepest, 1972–74, came with a correlation near zero (+0.04) and bonds roughly flat in nominal terms. Positive correlation matters more after inflation: in 1972–74 and 1946–48 bonds lost 14.7% and 20.3% in real terms while stocks fell. 2022 does not make either top five: its 60/40 drawdown was −21.6% nominal (−26.7% real). It was severe because stocks and bonds fell together, not because it was the deepest.
5. 2022
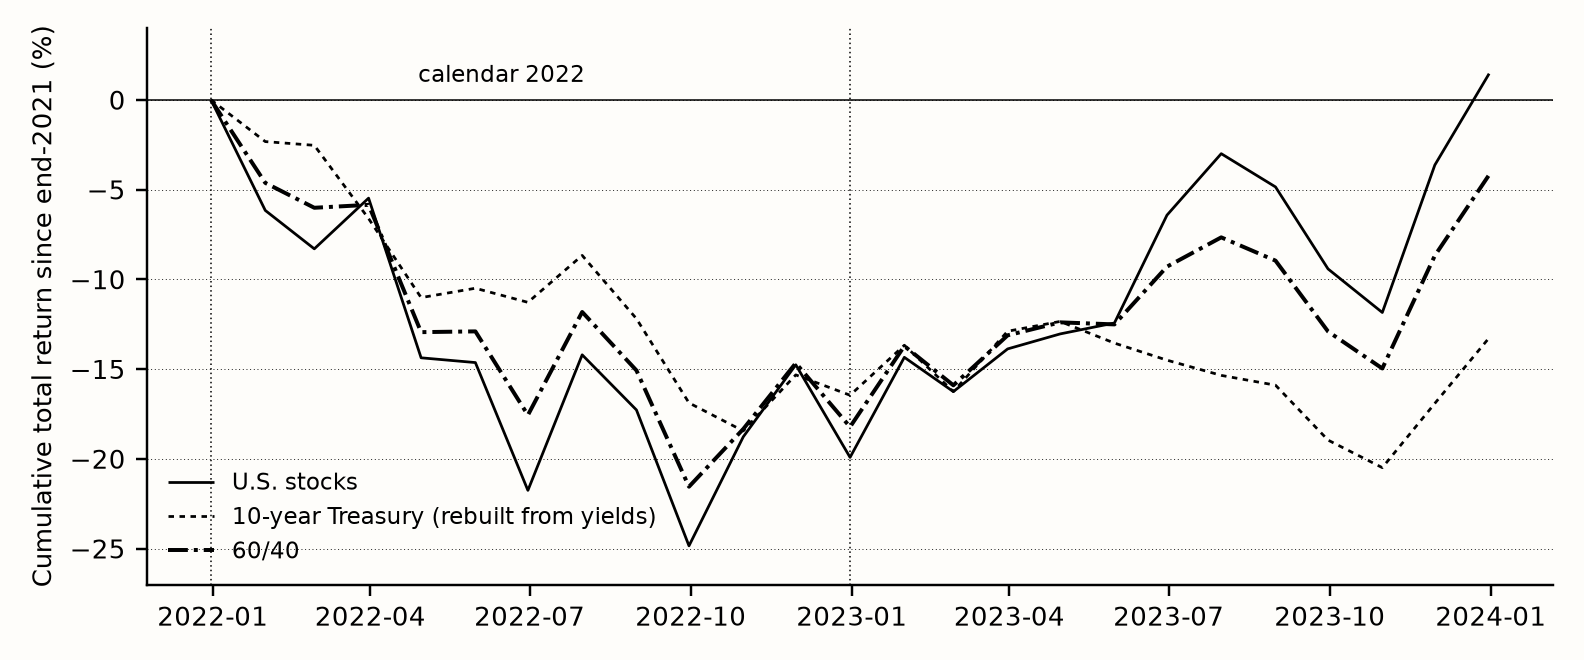
Figure 4. Cumulative total returns from the end of 2021 through 2023. The bond line is a 10-year par Treasury rebuilt from month-end FRED DGS10 yields.
Sources: Kenneth R. French Data Library (Fama/French 3 Factors, 202609 CRSP build); Robert J. Shiller, ie_data.xls; FRED series DGS10, GS10, CPIAUCSL; all downloaded November 13, 2026. Bond returns are rebuilt from 10-year Treasury yields. Calculations by AXION Alpha Systems.
| 2022 (calendar year) | Value |
|---|---|
| U.S. stocks, total return | −19.9% |
| 10-year Treasury, total return (rebuilt) — worst calendar year since 1927, nominal and real | −16.5% |
| 60/40, nominal / after inflation | −18.2% / −23.1% |
| CPI inflation, December to December | 6.4% |
| Months in which both stocks and bonds fell | 7 of 12 |
| Correlation of monthly / daily excess returns within 2022 | +0.59 / +0.17 |
| Worst real 60/40 calendar years since 1927 | 1974 (−24.9%), 2022 (−23.1%), 1937 (−23.1%) |
| 60/40 drawdown from Dec 2021; recovered (nominal / real) | −21.6% / −26.7%; Mar 2024 / Jul 2025 |
Calendar years in which both stocks and bonds lost money: 1941, 1969, 1994, 2022 (primary series). 2022 is the only one in which both losses were large. Note the gap between the monthly correlation (+0.59) and the daily one (+0.17): day to day the link was weak; over months both were driven down by the same force — rising inflation and interest rates.
6. After 2022
| Daily correlation | 2020 | 2021 | 2022 | 2023 | 2024 | 2025 | 2026 YTD |
|---|---|---|---|---|---|---|---|
| Stocks vs. 10-year Treasury | −0.47 | −0.11 | +0.17 | +0.07 | +0.06 | −0.14 | +0.45 |
2026 covers January 2 to September 30 (187 trading days).
The monthly 36-month correlation has stayed positive since Aug 2022. Daily correlations have been small and mixed since 2022 — slightly positive in 2023 and 2024, negative in 2025 — and turned clearly positive in 2026 so far. We draw no conclusion about what comes next.
How sensitive is this to the bond data?
Shiller’s bond series stops with the August-to-September 2024 return. After that, the averaged-yield variant uses the same formula on FRED GS10 (October 2024 to September 2026, 24 months in our sample). Our primary series does not depend on that gap, because since 1962 it uses month-end DGS10 yields; but it is just as much a yield rebuild. We compared three versions:
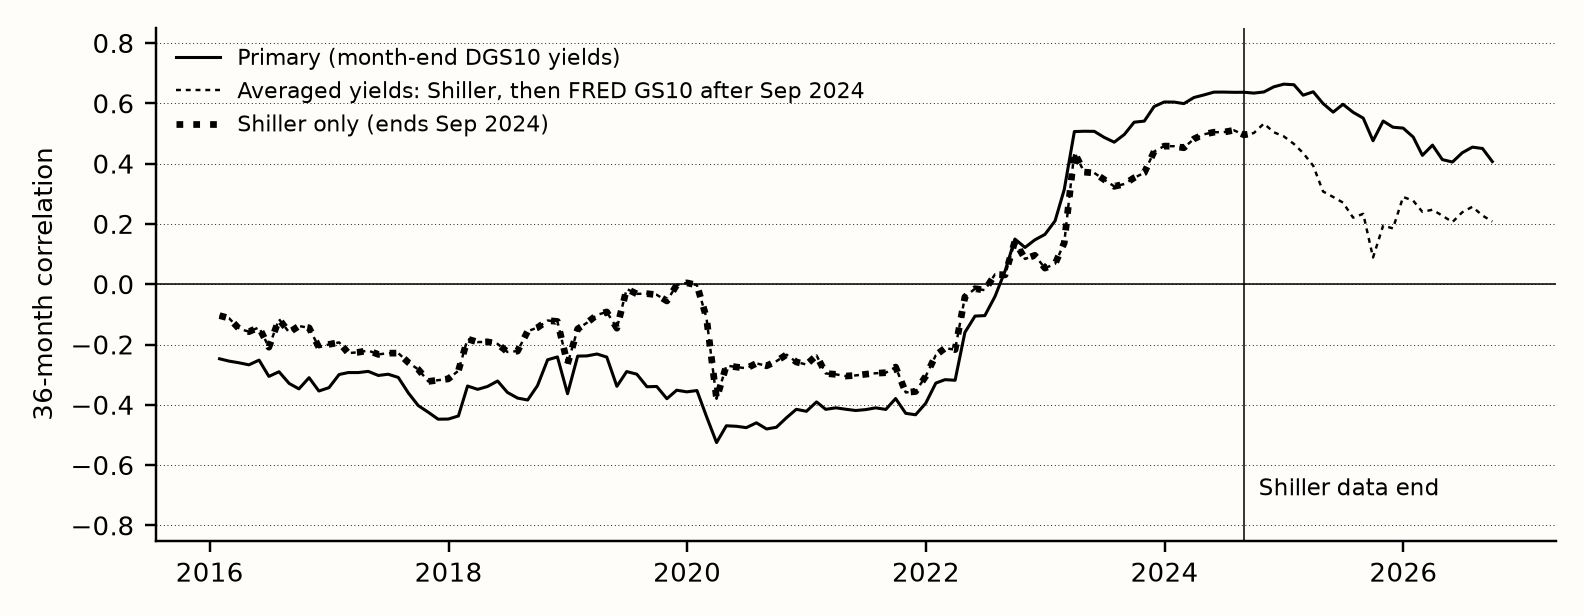
Figure 5. 36-month correlation since 2016 for the primary series, the averaged-yield series with the GS10 rebuild after September 2024, and Shiller’s series alone.
Sources: Kenneth R. French Data Library (Fama/French 3 Factors, 202609 CRSP build); Robert J. Shiller, ie_data.xls; FRED series DGS10, GS10, CPIAUCSL; all downloaded November 13, 2026. Bond returns are rebuilt from 10-year Treasury yields. Calculations by AXION Alpha Systems.
| Variant | Share of months positive | Inflation rank corr. (blocks) | Bad-month bond excess: neg. / pos. regime | End value | Both-negative years |
|---|---|---|---|---|---|
| V1 Primary (month-end yields from 1962) | 59% | 0.62 | +0.85% / −0.48% | 0.41 (Sep 2026) | 1941, 1969, 1994, 2022 |
| V2 Averaged yields, Shiller + GS10 rebuild after Sep 2024 | 64% | 0.68 | +0.63% / −0.24% | 0.21 (Sep 2026) | 1941, 1969, 1994, 2018, 2022 |
| V3 Averaged yields, Shiller only (stops Sep 2024) | 63% | 0.67 | +0.63% / −0.26% | 0.50 (Sep 2024) | 1941, 1969, 1994, 2018, 2022 |
- The post-2024 rebuild barely moves the long-run statistics (V2 versus V3): share positive 63.6% versus 62.8%, inflation rank correlation 0.68 versus 0.67. It matters only for the recent level, which no long-run statistic can settle.
- Yield timing matters more than the gap. Monthly-average yields (V2) put the current 36-month correlation at 0.21; month-end yields (V1) put it at 0.41. Both are positive. 2018 counts as a “both negative” year only in the averaged-yield series (the bond return is −0.9% there versus +0.3% with month-end yields).
- Other pre-registered variants: total instead of excess returns, share positive 60% and block rank correlation 0.58; 24- and 60-month windows, share positive 54% and 63%, with the same 2000–2022 negative regime and positive readings since 2022.
What it means
The comfortable assumption of the last two decades — that Treasuries reliably rise when stocks fall — describes 2000–2021 well and the century as a whole poorly. Over most of the record, stocks and bonds moved together more often than not, and that tended to coincide with higher and more uncertain inflation. Since mid-2022 the correlation has been positive again.
That does not mean the 60/40 portfolio “stopped working”. Its deepest nominal losses came in stock crashes when bonds did help. What a positive correlation took away was protection against inflationary losses, which show up after inflation and over years, not days: 1946–48, 1973–74, and 2022.
For Note 01, the lesson is narrow. A strategy designed for correlation stress needs test periods that contain it, and 1996–2006 did not contain this kind. Nothing here rescues the correlation overlay that failed in Note 01, and nothing here is a rule for when to own bonds.
Limitations
- Bond returns are rebuilt, not traded. Every bond return is a 10-year par bond repriced from a yield: no traded index, no costs, no taxes, and simplified coupon and maturity treatment. Shiller’s pre-1962 inputs are monthly averages, which blur timing; we aligned them using bond data only, but some timing error remains.
- The Shiller gap. Shiller’s series ends with the August–September 2024 return; we rebuilt later returns with the same formula from FRED. His file also appears to contain a one-month shift in its June–July 2019 yields, which affects the averaged-yield variants (not the primary series after 1962).
- Few independent regimes. A century contains only a handful of long correlation regimes. Rolling windows overlap heavily, so the record looks far more informative than it is. The p-values above treat blocks and years as independent and overstate certainty.
- Hindsight. Regimes are obvious looking back and unclear in real time; the 36-month window reacts slowly by construction. Nothing here is a timing signal.
- Two pre-run deviations from the plan. The month-end series starts in February 1962 (not January), because the first month-end yield is January 1962. The October 2025 CPI value is missing at FRED; we noticed this after the first full run and filled it by interpolation. That fix changed no stock–bond correlation and no 2022 figure; it affects only after-inflation figures that span late 2025. The splice fix was made before any stock–bond statistic was computed.
- Scope. U.S. data only; one bond maturity (10 years); a stock market index, not investable funds; no international, corporate, or inflation-linked bonds. Breakeven inflation (FRED T10YIE) was downloaded for context but not used in any reported statistic.
- Not blind. The broad pattern was known from published research before we started.
Data sources
Kenneth R. French Data Library: Fama/French 3 Factors, monthly and daily (files created from the 202609 CRSP database). Robert J. Shiller, ie_data.xls (shillerdata.com), column “Monthly Total Bond Returns” and its formula, and CPI. FRED, Federal Reserve Bank of St. Louis: DGS10, GS10, CPIAUCSL, T10YIE, TB3MS, USREC. Raw snapshots and SHA-256 fingerprints are kept with the code:
| File | Downloaded | SHA-256 (first 16) |
|---|---|---|
| F-F_Research_Data_Factors_CSV.zip | 2026-11-13 12:01 MST | b03d39e4bb253dda… |
| F-F_Research_Data_Factors_daily_CSV.zip | 2026-11-13 12:01 MST | 96c23b88e651cbff… |
| ie_data.xls | 2026-11-13 12:01 MST | 59532175bd1b95ce… |
| GS10.csv | 2026-11-13 12:01 MST | 018e609eb98c52ec… |
| DGS10.csv | 2026-11-13 12:01 MST | 58b7691336499c4e… |
| CPIAUCSL.csv | 2026-11-13 12:01 MST | c9be2d4909ffd28d… |
| T10YIE.csv | 2026-11-13 12:01 MST | 625568fd298058b3… |
| TB3MS.csv | 2026-11-13 12:01 MST | 33fae406051a658c… |
| USREC.csv | 2026-11-13 12:01 MST | 7d28698513be7460… |
References
Baele, L., Bekaert, G., & Inghelbrecht, K. (2010). The Determinants of Stock and Bond Return Comovements. Review of Financial Studies, 23(6), 2374–2428. https://doi.org/10.1093/rfs/hhq014
Campbell, J. Y., Sunderam, A., & Viceira, L. M. (2017). Inflation Bets or Deflation Hedges? The Changing Risks of Nominal Bonds. Critical Finance Review, 6(2), 263–301. https://doi.org/10.1561/104.00000043
Ilmanen, A. (2003). Stock-Bond Correlations. Journal of Fixed Income, 13(2), 55–66. https://doi.org/10.3905/jfi.2003.319353
Next steps
The 24-month live paper test of AXCN v1.1 continues and is unaffected by this note. If a later note studies how correlation regimes affect allocation choices, it should be pre-registered and tested on data that contains positive-correlation, inflationary periods — not tuned to them after the fact.
AXION Alpha Systems, Independent Research. Note 02. Analysis plan SHA-256 1cc1ecd2c66457eb7fad042bf90482b2f30fb1a419fb6623f3834e96b55153e6. Code and data snapshots: research/note02/.
For educational purposes only. Not financial advice. AXION Alpha Systems, an independent research and education firm operated under MiraVex Holdings, is not a registered investment adviser or broker-dealer. Nothing in this note is a recommendation to buy, sell, or hold any security or to follow any strategy. Historical and rebuilt returns describe the past only and do not guarantee future results.