
The Limits of Adaptive Diversification
Evaluating the effectiveness of correlation-based portfolio risk controls
AXION Research Note No. 1 · Drafted November 11, 2026 · Holdout run November 4, 2026 (America/Denver)
Summary
We wrote down the rules of AXCN — a multi-asset allocation built around a correlation overlay — froze them, and tested them once on reserved history: January 1996 through December 2006. The strategy failed 3 of 6 pre-registered tests, so v1 did not pass.
The defensive half held up. AXCN stayed positive through the 2000–02 bear market and produced a higher Sharpe ratio (average return above cash, divided by how bumpy the returns were) than a 60/40 stock/bond mix scaled to the same volatility. The correlation overlay, the supposed edge, subtracted value. The same strategy without those pieces had a higher Sharpe ratio, and two published correlation-aware methods also beat it on the same data. This note reports the result as-is. It does not claim the strategy is validated or that AXCN creates a new category of product.
The hypothesis
Most portfolios look diversified until stress arrives. Then assets that usually move independently start moving together — their correlation, the tendency of two return series to travel in the same direction, rises — and the portfolio behaves like one bet. AXCN was designed to detect that dilution and respond, using three mechanisms:
- Volatility scaling. Volatility is how much an asset’s returns bounce around. Weights start inversely proportional to recent volatility, then the risky book is scaled toward an 8% volatility target, with no leverage.
- A correlation engine. Assets that move closely with the rest of the portfolio have their weights cut. A market-wide absorption ratio (a published measure of how much risk is packed into a few common factors) can cut all risky sleeves by 25% when it is elevated.
- A trend filter. Assets with a negative 12-month excess return have their weights halved, or cut to zero if they are also highly correlated with the rest of the book. Cut capital goes to T-bills.
The universe is U.S. large- and small-cap stocks, developed-market stocks outside the U.S., U.S. REITs, long and intermediate Treasuries, gold, broad commodities, and cash. Gold was excluded from this holdout by a pre-registered decision, and commodities were absent until mid-2003. The claim under test was that the correlation pieces would add a higher Sharpe ratio, or a shallower drawdown (peak-to-trough decline), beyond volatility scaling, trend, and methods already in the literature.
How we tested it
Pre-registration means writing the rules and the pass/fail tests before seeing the results, then refusing to change them afterward. We froze a written rulebook on November 4, 2026. The frozen v1.1 file carries a SHA-256 hash, a unique fingerprint of the exact text, checked immediately before the run:
f2a633b63316947e16479b4235d72b3881409d0ec2ea740a20cc8e42127ef8ed
Why there is a v1.1. A v1.0 rulebook was frozen earlier that day. Before any signals or returns were computed, we found that the REIT stand-in fund, VGSIX, has real prices only from May 13, 1996, too late for a trend signal at the January 1996 start. Jesus approved a pre-run amendment, with the holdout still unseen, recorded as v1.1. REITs enter at the first month-end with 252 trading days of VGSIX history (about May 1997). Four implementation details were also written down: the volatility window, how the equity floor treats down-trending sleeves, the daily T-bill return formula, and the trials log. The v1.0 files were left untouched.
A holdout is a stretch of history reserved for a single test, not used to design the rules. Ours is January 1996 through December 2006, run once. Signals use each month-end close and trade at the next day’s close. A 0.25% annual fee and trading costs of 2 to 10 basis points per unit of turnover (how much of the portfolio is traded) are deducted; every figure below is net of both.
A 2007–2026 period had already been inspected in an earlier stress test, so it could not serve as a clean test. Those 65 earlier trials, plus this holdout, give N = 66. After that many tries, a raw Sharpe ratio would overstate significance, so we also report the Deflated Sharpe Ratio of Bailey and López de Prado, which adjusts for the number of trials and the shape of the return series. Nothing was tuned or rerun after the results were seen.
Results
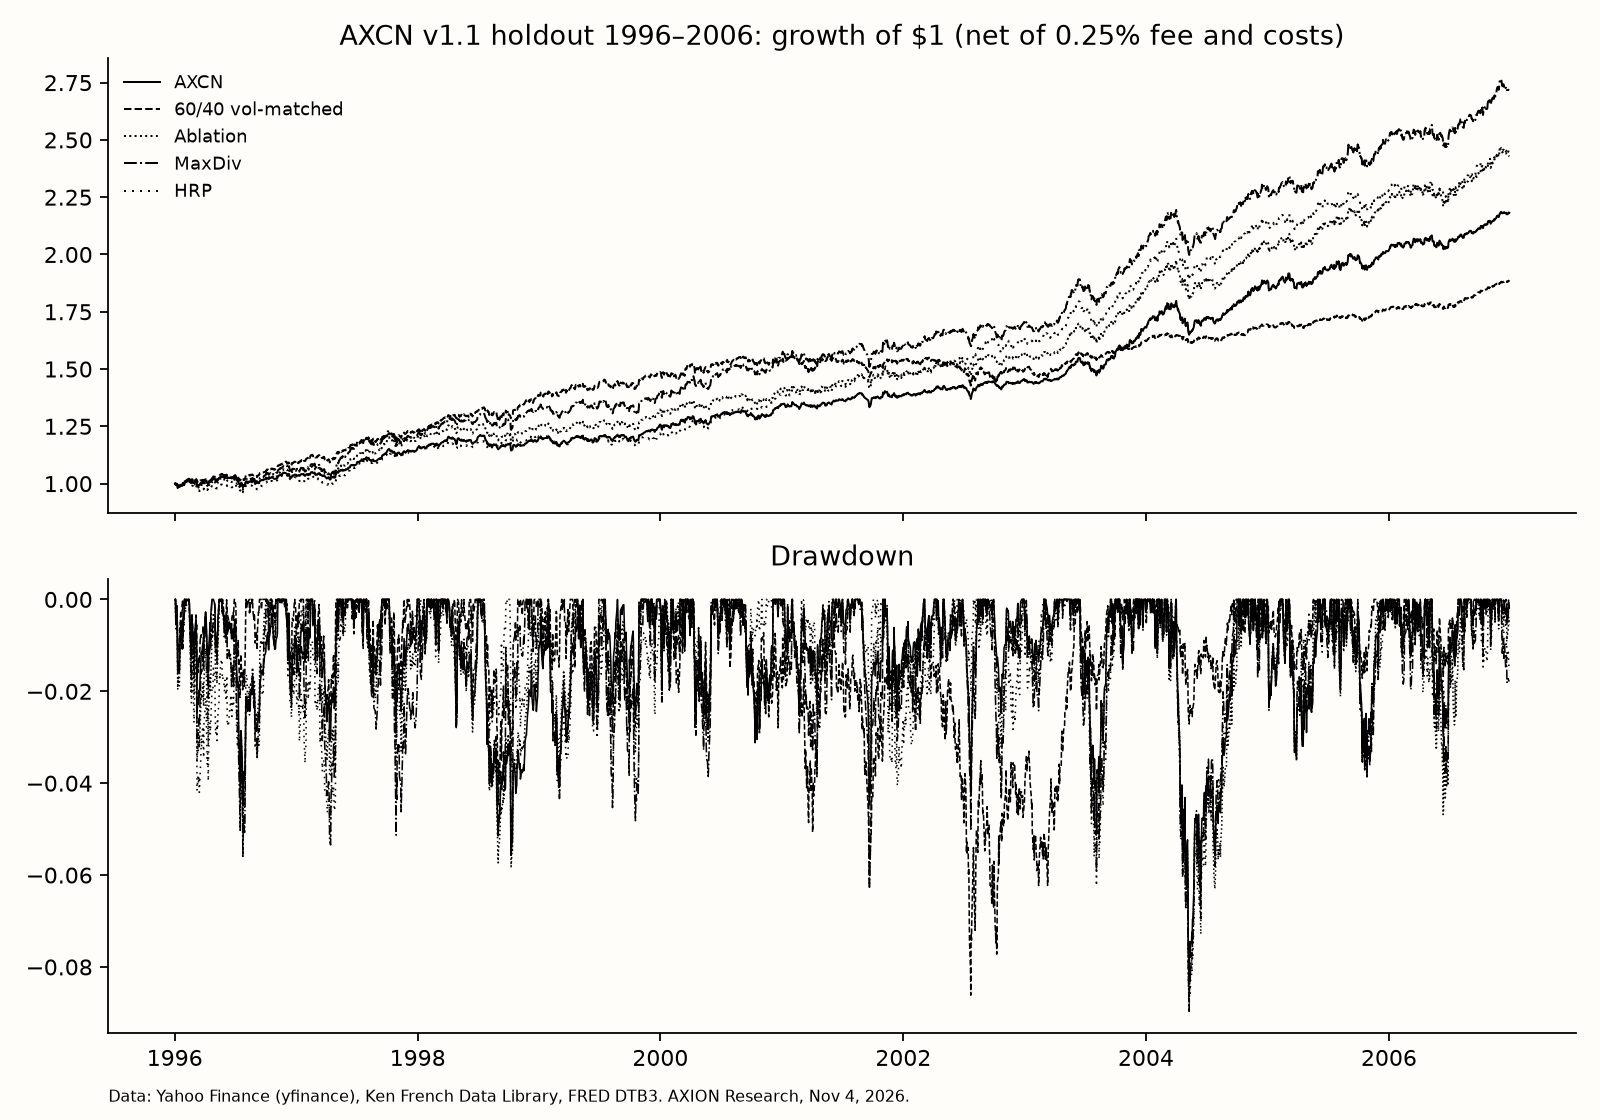
Figures are for January 2, 1996 through December 29, 2006. Every line was rebalanced monthly under the same trading-band rules and charged the same fee and costs. CAGR is the constant annual growth rate that would have produced the same ending wealth. The last column is the total return over the 2000–02 bear market.
| Strategy | CAGR | Vol | Sharpe | Max drawdown | Turnover/yr | 2000–02 return |
|---|---|---|---|---|---|---|
| AXCN v1.1 | 7.36% | 4.99% | 0.708 | −8.23% | 1.35× | +15.7% |
| 60/40, scaled to AXCN’s volatility | 5.92% | 4.99% | 0.438 | −8.61% | 0.07× | +0.4% |
| Ablation (same rules, no correlation pieces) | 8.49% | 5.68% | 0.814 | −8.71% | 0.71× | +18.9% |
| Maximum Diversification | 9.52% | 6.50% | 0.864 | −8.96% | 0.99× | +21.2% |
| Hierarchical Risk Parity (HRP) | 8.41% | 5.66% | 0.803 | −9.00% | 0.62× | +34.6% |
| Equal weight of eligible sleeves | 9.67% | 9.06% | 0.658 | −14.97% | 0.19× | −0.6% |
| 60/40, unscaled (reference only) | 8.21% | 10.96% | 0.438 | −24.06% | 0.15× | −12.7% |
| U.S. large-cap stocks (SPY sleeve) | 9.17% | 18.47% | 0.368 | −47.85% | 0.09× | −38.0% |
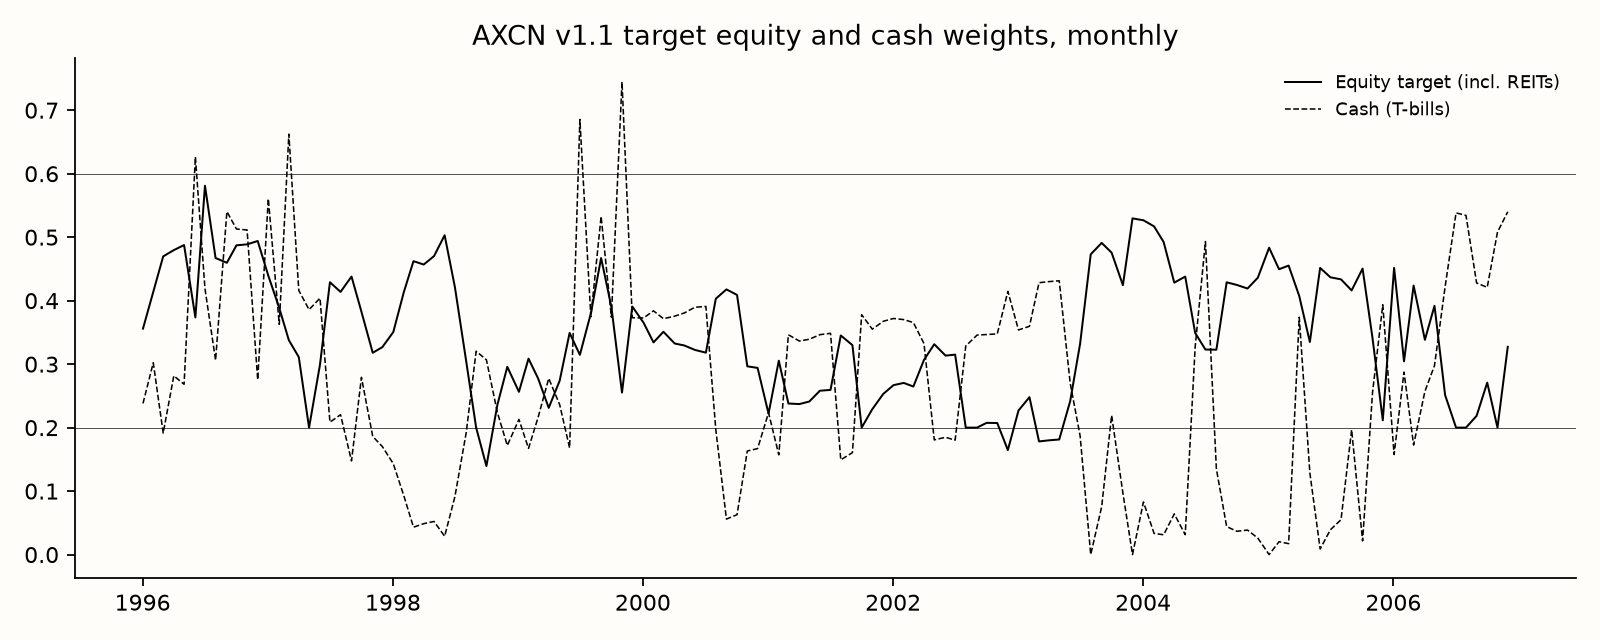
The primary benchmark is a volatility-matched 60/40: 60% U.S. large-cap stocks and 40% intermediate Treasuries, mixed with T-bills so its volatility equals AXCN’s over the full test (scale factor 0.456). Raw 60/40 and stocks are context only. The ablation is AXCN without the correlation engine and the absorption-ratio rule, leaving volatility scaling, trend, the 8% target, and the equity band. Maximum Diversification (Choueifaty and Coignard, 2008) and Hierarchical Risk Parity (López de Prado, 2016) are published methods, run on the same sleeves, covariance estimates, and schedule. AXCN held about 35% in equity sleeves, including REITs, and about 27% in cash, on average. At three times the usual trading costs, its Sharpe ratio was still 0.656; gross of the 0.25% fee it was 0.758.
Figure 1. Growth of $1 (top) and drawdowns (bottom) in the 1996–2006 holdout, net of a 0.25% fee and trading costs. AXCN is the solid line.
Figure 2. AXCN’s monthly target equity weight (including REITs) and cash weight. The horizontal lines mark the 20% and 60% equity bounds.
Each pre-registered test
v1 passes only if all six hold. Three did not.
| # | Test | Result | The numbers |
|---|---|---|---|
| 1 | Deflated Sharpe Ratio above 0.95 | PASS | 0.974 (N = 66) |
| 2 | Sharpe at least that of the vol-matched 60/40, and the difference not significantly negative | PASS | 0.708 vs 0.438; one-sided bootstrap p = 0.868 |
| 3 | Max drawdown no worse than 75% of the vol-matched 60/40’s | FAIL | −8.23% vs a limit of −6.46% |
| 4 | Beats the ablation: Sharpe at least 0.05 higher, or a drawdown at least 3 points shallower | FAIL | 0.708 vs a 0.864 hurdle (0.814 + 0.05); drawdown only 0.48 points shallower (−8.23% vs −8.71%) |
| 5 | Sharpe at least the weaker of Maximum Diversification and HRP | FAIL | 0.708, below 0.803 (the lower of 0.864 and 0.803) |
| 6 | Turnover at most 1.5× per year, and a positive Sharpe ratio at 3× costs | PASS | 1.35× per year; Sharpe 0.656 at 3× costs |
A caveat on criterion 2, which is easy to over-read. The rule required a Sharpe ratio at least as high as the volatility-matched 60/40, and a test that the difference was not significantly negative. The one-sided bootstrap p-value of 0.868 — obtained by resampling 21-day blocks of returns 5,000 times — meets that second bar. It does not mean the 0.27 Sharpe-ratio gap is statistically strong evidence that AXCN is better. It means we cannot show that AXCN is worse. With only eleven years of daily returns, a gap of that size can easily be luck. Treat the 60/40 comparison as a pass on a modest hurdle, not as a finding of outperformance.
What it means
The defensive design did what a low-volatility, trend-filtered allocation is supposed to do in a stock bear market. AXCN gained 15.7% in 2000–02, while the stock sleeve lost 38.0% and a raw 60/40 lost 12.7%. The Deflated Sharpe Ratio cleared 0.95 after 66 trials.
The correlation overlay is the strategy’s reason for existing, and in this test it made results worse. Removing it raised the Sharpe ratio by about 0.11, from 0.708 to 0.814, and did not meaningfully worsen the drawdown. The absorption-ratio “risk-off” flag was on in 20% of months; it mainly added cash and turnover (1.35× per year, versus 0.71× without the correlation pieces). The 8% volatility target never bound (scale factor 1.0 every month). Maximum Diversification and HRP produced higher Sharpe ratios and similar drawdowns on the same sleeves.
Because criteria 3, 4, and 5 failed, v1 did not pass. We will not describe AXCN as validated or as category-creating, and we will not claim an edge from “correlation structure.” What this holdout supports is narrower: a volatility-scaled, trend-filtered multi-asset allocation; its correlation overlay did not add value in a 1996–2006 holdout.
Limitations
- Incomplete universe. Gold is absent throughout. Commodities are absent until mid-2003. PCRIX, the PIMCO CommodityRealReturn Strategy Fund Institutional Class, has an inception date of June 28, 2002, per PIMCO’s fund page, and the rulebook requires 252 trading days of history before the sleeve can enter. The holdout therefore tests a 5- to 7-sleeve version, not the full live universe.
- Proxies. Before the corresponding ETFs existed, several sleeves use mutual funds or, for developed-market stocks in 1996–1999, Ken French Data Library index returns. Fund expense ratios stay in the prices; the French index has no fee. Splices mix instruments.
- Data quality. Yahoo Finance adjusted closes are free and unaudited. Only funds that still exist could be used, which introduces some survivorship bias, though each sleeve is a broad index fund. Daily T-bill returns are approximated as the FRED DTB3 discount yield divided by 100, then by 252.
- A short sample. Eleven years, with one major equity bear market (2000–02). The window excludes 2008, February–March 2020, and 2022, when stocks and bonds fell together — the regime the thesis worries about.
- Statistics. Sharpe-ratio differences of about 0.1 over eleven years sit inside sampling noise. The Deflated Sharpe Ratio uses 65 earlier trial Sharpes from a different period and data set, a practical approximation.
Data sources, all pulled November 4, 2026: Yahoo Finance adjusted closes via the yfinance library; the Ken French Data Library, Developed ex-U.S. daily factors (file built from the September 2026 Bloomberg database); FRED series DTB3 (3-month Treasury bill). PCRIX’s inception date is from PIMCO, as cited above.
Next steps
The rulebook still requires a 24-month live paper-trading test, starting after the freeze, before any public performance claim. That clock is running; this holdout does not replace it. Any change to a rule, parameter, universe, or cost assumption is v2. Under the freeze rules, v2 resets the live out-of-sample clock and has no clean historical holdout, because this one has now been seen. If the correlation overlay is redesigned, that should be said plainly, the trial count should carry forward, and the live test — not another trip through 1996–2006 — should be the evidence. The honest next question is whether a simpler volatility-scaled, trend-filtered allocation, or an existing method such as Maximum Diversification or HRP, is the better design to take into that live test.
AXION Alpha Systems, Independent Research. Rulebook v1.1, SHA-256 f2a633b63316947e16479b4235d72b3881409d0ec2ea740a20cc8e42127ef8ed. Trial 66 / holdout #1.
For educational purposes only. Not financial advice.